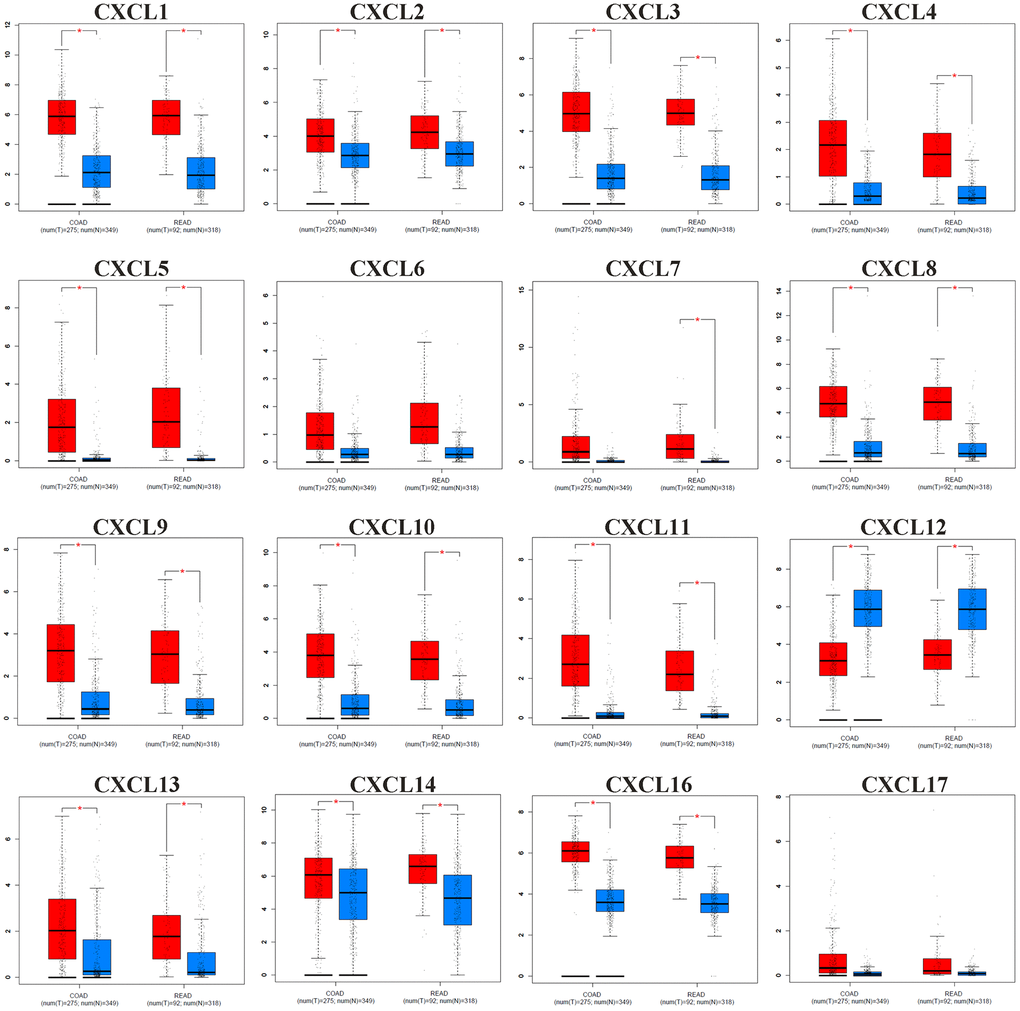
Figure 2.The mRNA expression pattern of CXC chemokines (CXCL1/2/3/4/5/6/7/8/9/10/11/12/13/14/16/17) from GEPIA between CRC tissues (red) and normal tissues (blue). The P-value was set at 0.05, * indicate that the results are statistically significant.