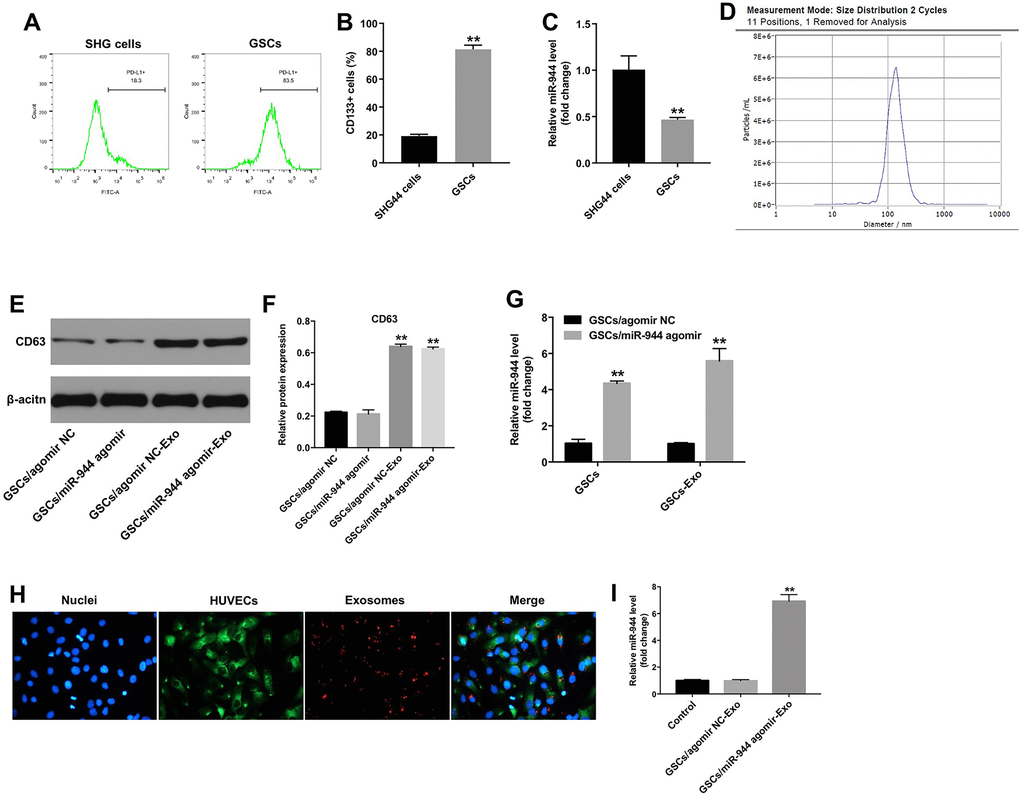
Figure 4.Exosomes transport GSC-derived miR-944 to HUVECs. (A, B) Flow cytometry analysis shows isolation and enrichment of CD133+ GSCs from SHG44 cells. ** denotes P < 0.01 vs. SHG44 cell group. (C) RT-qPCR analysis shows miR-944 levels in SHG44 cells and CD133+ GSCs. **P < 0.01 vs. SHG44 cell group. (D) NTA results show mean diameter of exosomes isolated from the conditioned medium of agomiR-944-transfected GSCs. (E, F) Western blotting analysis shows CD63 levels in agomir-NC-transfected GSCs (GSC/agomiR-NC), agomiR-944-transfected GSCs (GSC/agomiR-944), GSC/agomir-NC-derived exosomes (GSC/agomiR-NC-Exo), and GSC/agomiR-944 agomir-derived exosomes (GSC/agomiR-944-Exo). **P < 0.01 vs. the GSC/agomiR-NC group. (G) RT-qPCR analysis shows miR-944 expression levels in GSC/agomiR-NC, GSC/agomiR-944, GSC/agomiR-NC-Exo, and GSC/agomiR-944-Exo. **P < 0.01 vs. the GSC/agomir-NC group. (H) Confocal microscopy images show exosomes and their uptake into HUVECs. Exosomes are stained with PKH67 (red color); HUVECs are stained with phalloidin-FITC (green color); nuclei are stained with DAPI (blue color). (I) RT-qPCR analysis shows miR-944 levels in HUVECs co-cultured with GSC/agomiR-NC-Exo or GSC/agomiR-944-Exo. **P < 0.01 vs. the GSC/agomir-NC-exo group. GSCs, glioma stem cells; HUVECs, human umbilical vein endothelial cells.