Submit an Article
Navigate
Home
Editorial Board
Editorial Policies
Current Volume
Archive
Scientific Integrity
Publication Ethics Statements
Interviews with Outstanding Authors
Newsroom
Sponsored Conferences
Podcast
Contact
Special Collections
Submit an Article
Online ISSN: 1945-4589
Research Paper
|
Volume 13, Issue 13
|
pp. 17516–17535
Glycolysis- and immune-related novel prognostic biomarkers of Ewing's sarcoma: glucuronic acid epimerase and triosephosphate isomerase 1
Back to article
Figure 10
(10 of 13)
−
100%
+
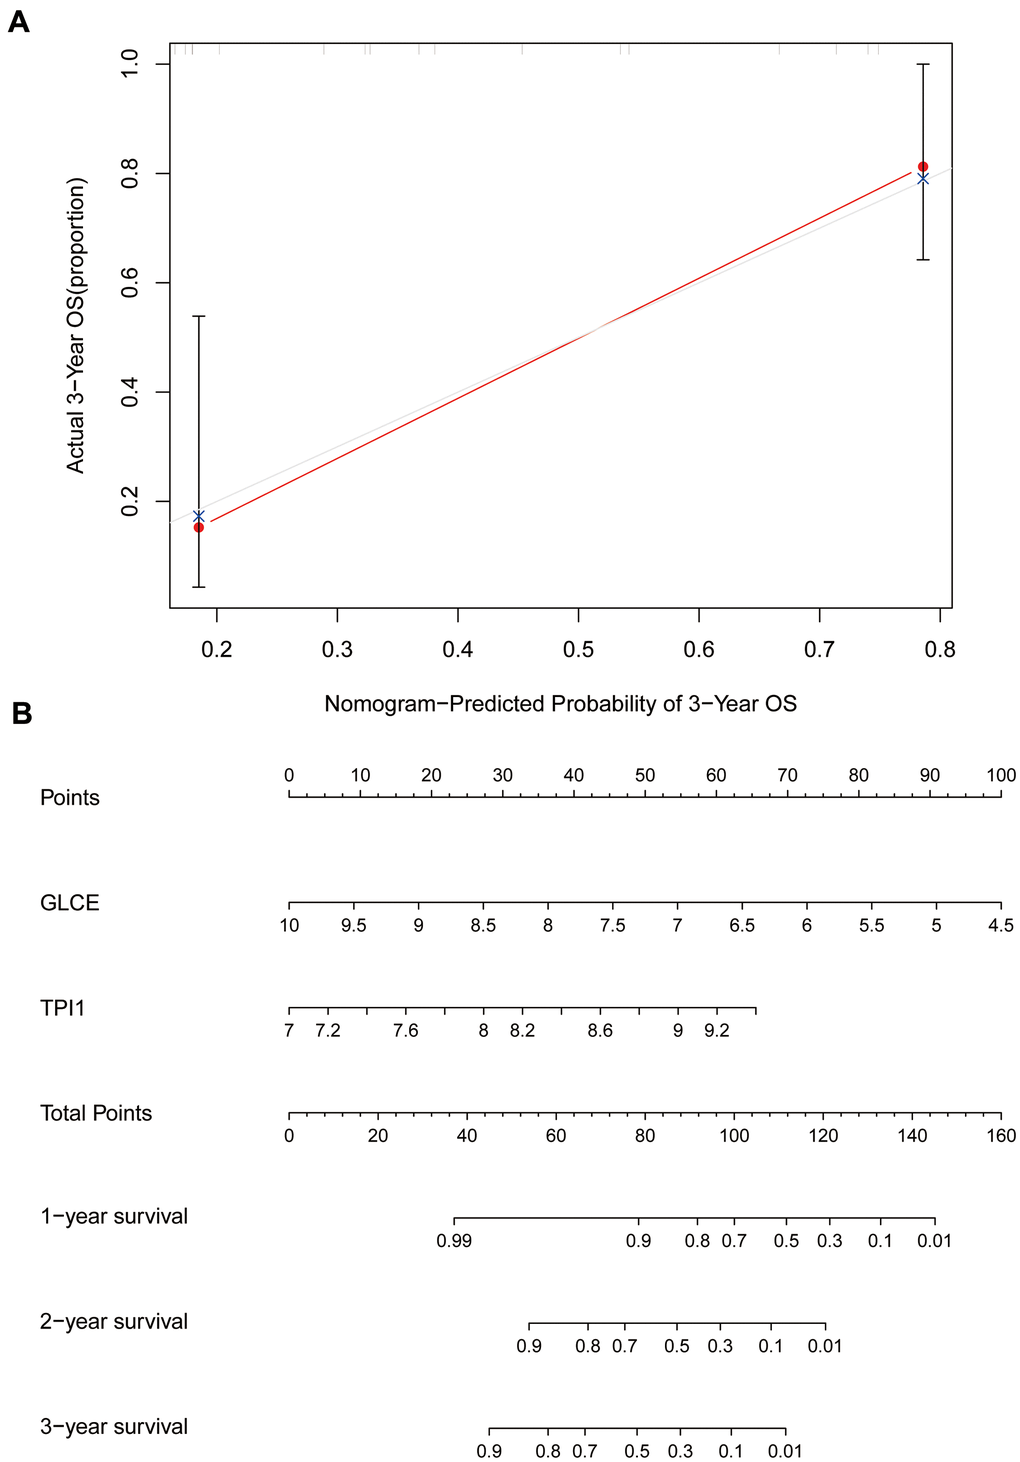
Figure 10.
Calibration and column line plots.
(
A
) The calibration plot; the red line segments denote the predicted line segments and the grey line segments denote the true-case segments. (
B
) The column line plots for the predicted prognosis.