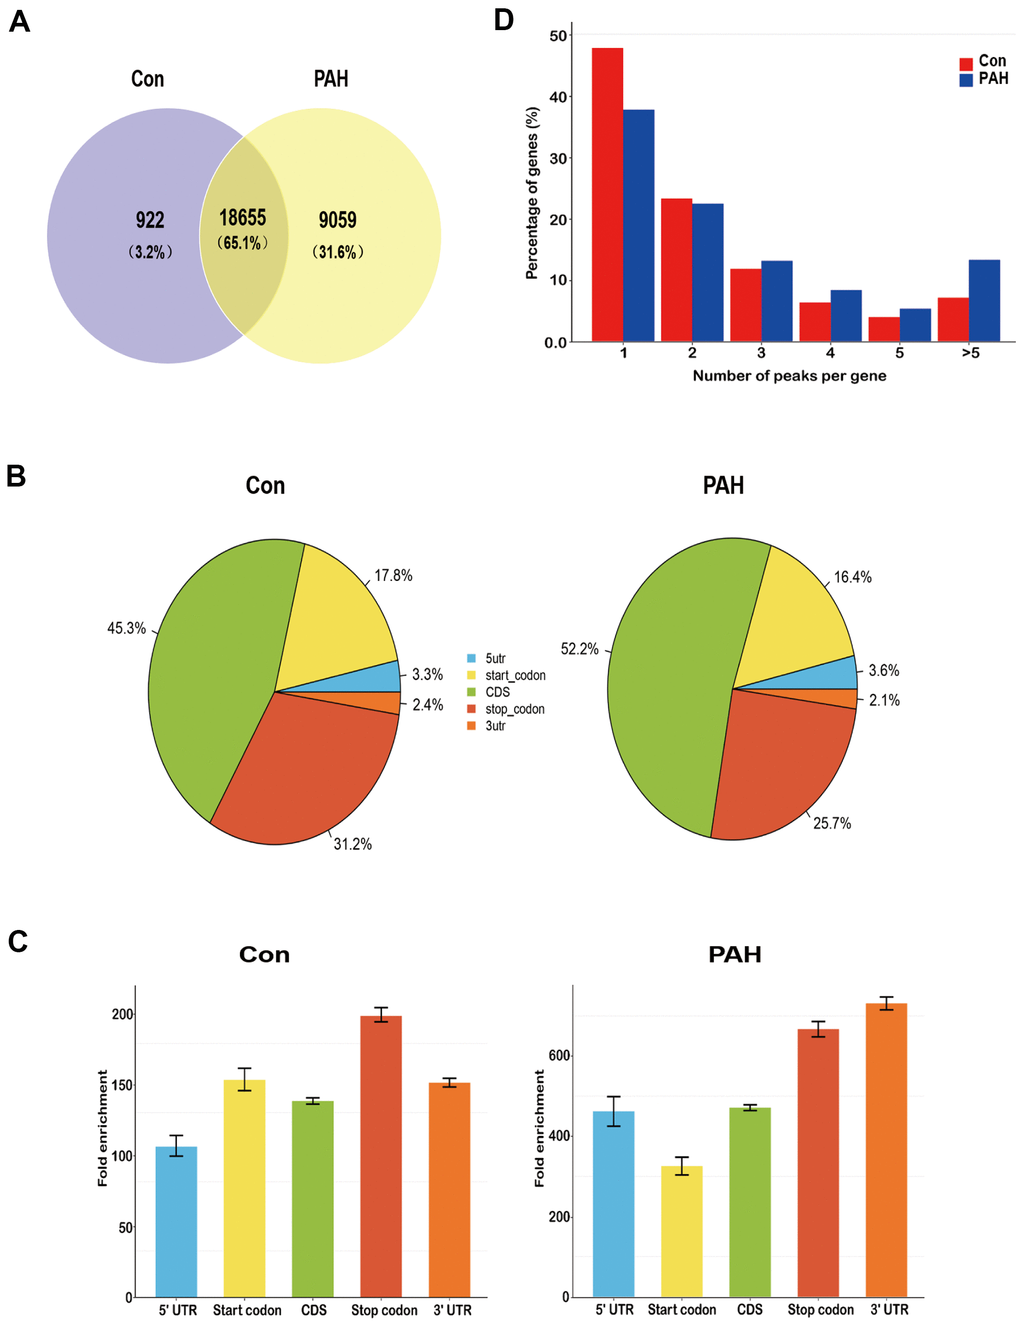
Figure 2.Overview of N6-methyladenosine methylation within mRNAs in the control and MCT groups. (A) Venn diagram showing the overlap of m6A peaks within mRNAs in two groups. (B) Pie charts showing the percentage of m6A peaks in five non-overlapping segments of transcripts. Both the control group and the PAH group had the most abundant m6A peak in the coding sequence. (C) Distributions of fold enrichment of m6A peaks in five segments. The mean fold enrichment in the stop codon segments was the largest in the control group, while that value in 3' UTR was the largest in the PAH group. Error bars represent the standard error of the mean. (D) Proportion of genes harboring different numbers of m6A peaks in two groups. Most genes have only one m6A peak.