Submit an Article
Navigate
Home
Editorial Board
Editorial Policies
Current Volume
Archive
Scientific Integrity
Publication Ethics Statements
Interviews with Outstanding Authors
Newsroom
Sponsored Conferences
Podcast
Contact
Special Collections
Submit an Article
Online ISSN: 1945-4589
Research Paper
|
Volume 13, Issue 13
|
pp. 17337–17348
Age as a modifier of the effects of chemoradiotherapy with infusional 5-fluorouracil after D2 dissection in gastric cancer
Back to article
Figure 2
(2 of 4)
−
100%
+
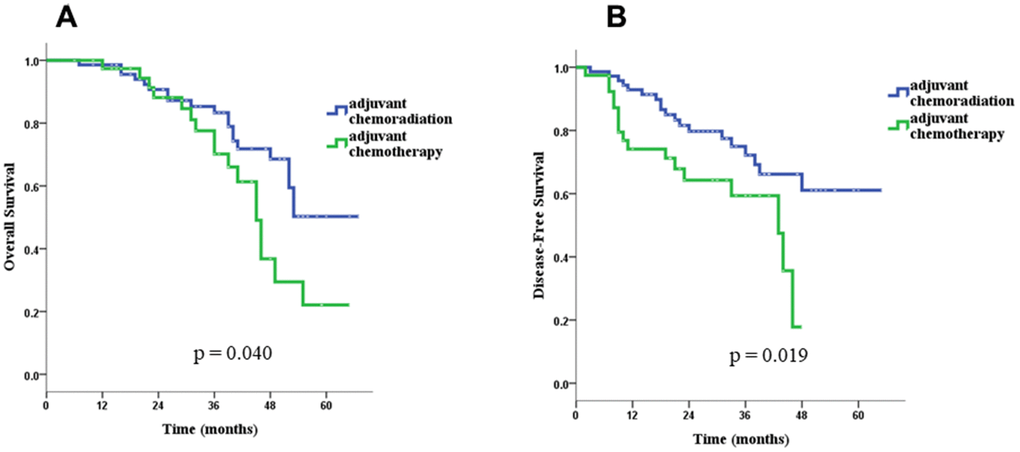
Figure 2.
Overall survival (
A
) and disease-free survival (
B
) for the CCRT group and the CT-alone group in the whole group of patients.