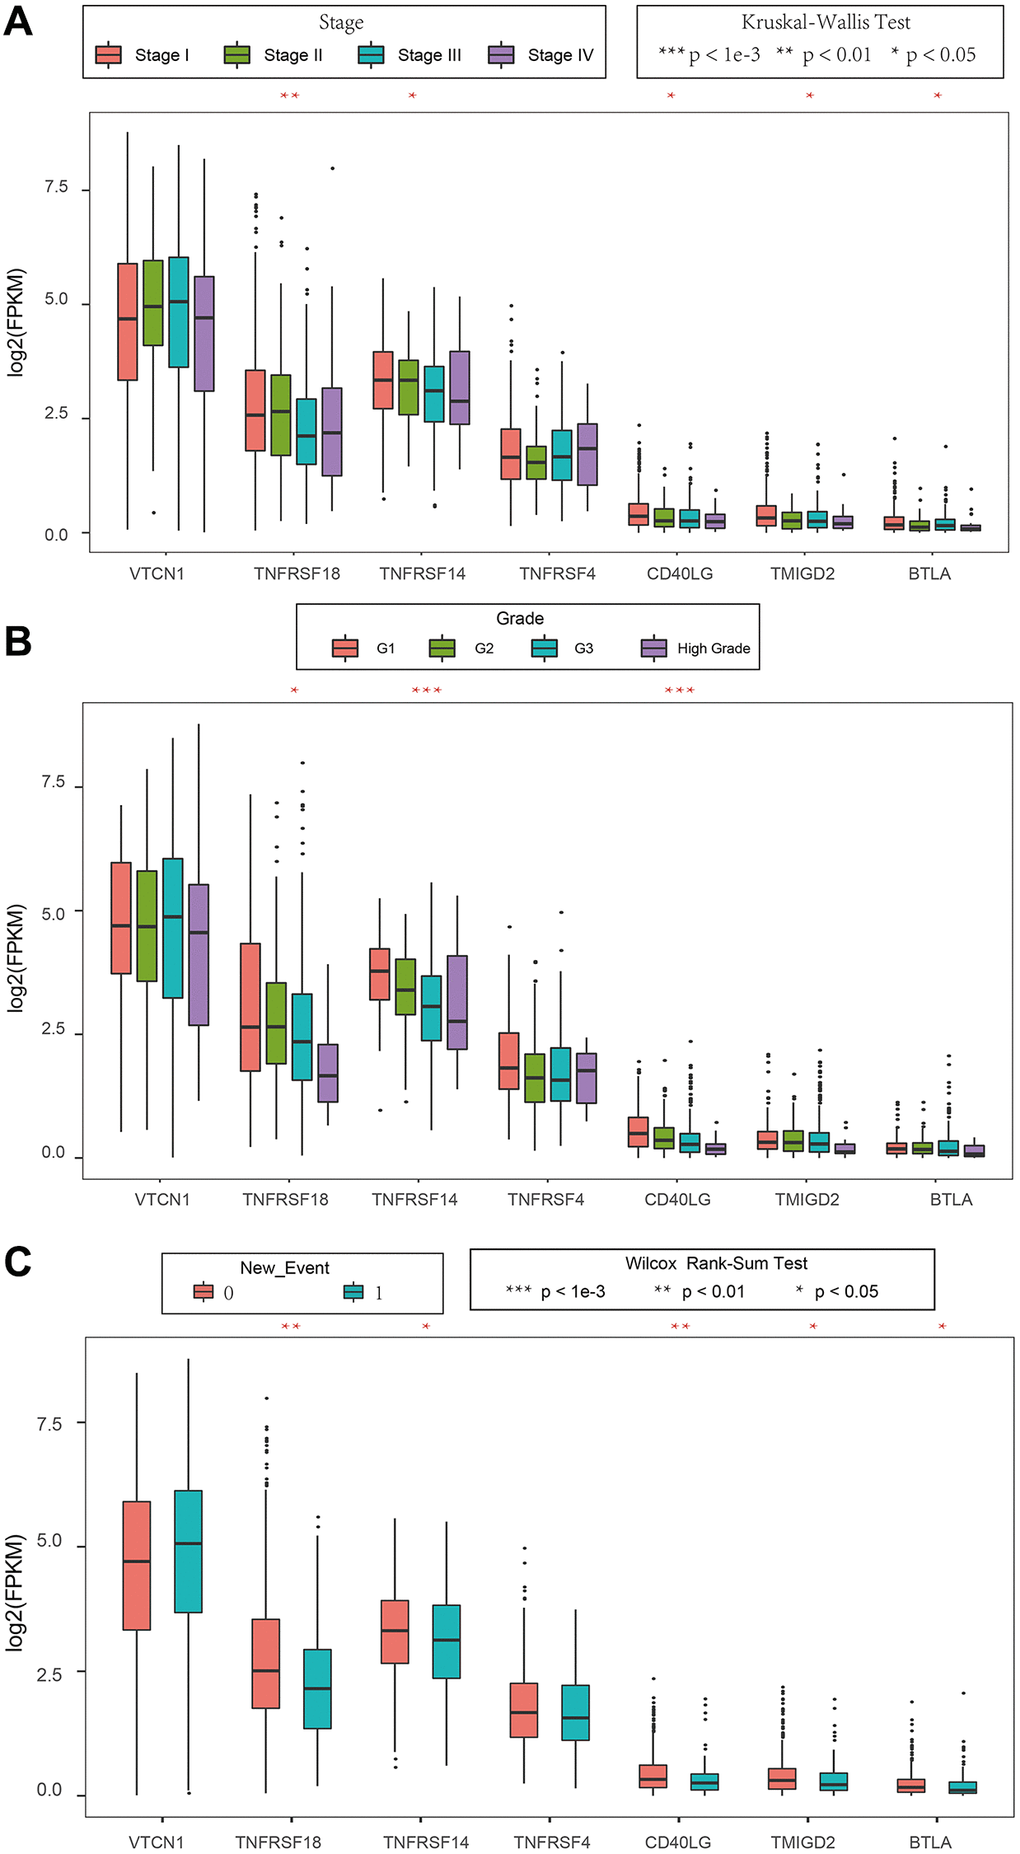
Figure 8.Association between ICGs and clinicopathological variables in EC. (A–C) Box plot shows expression values (FPKM) of seven prognostic ICGs in various (A) tumor stages, (B) tumor grades, and (C) new events of EC patients. The abscissa represents ICGs and ordinate represents their gene expression values.