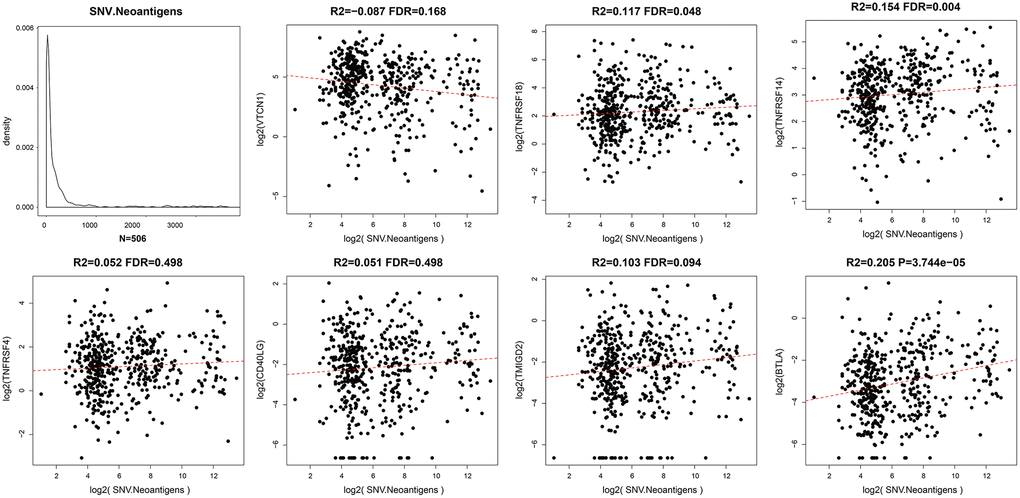
Figure 6.Relationship between ICGs and neoantigens in EC. Scatter diagram demonstrates correlation between expression levels of ICGs and neoantigens in EC tissues. R2 refers to the correlation coefficient; FDR indicates false detection rate. The abscissa represents log2 (expression of neoantigens) and ordinate represents expression levels of different ICGs.