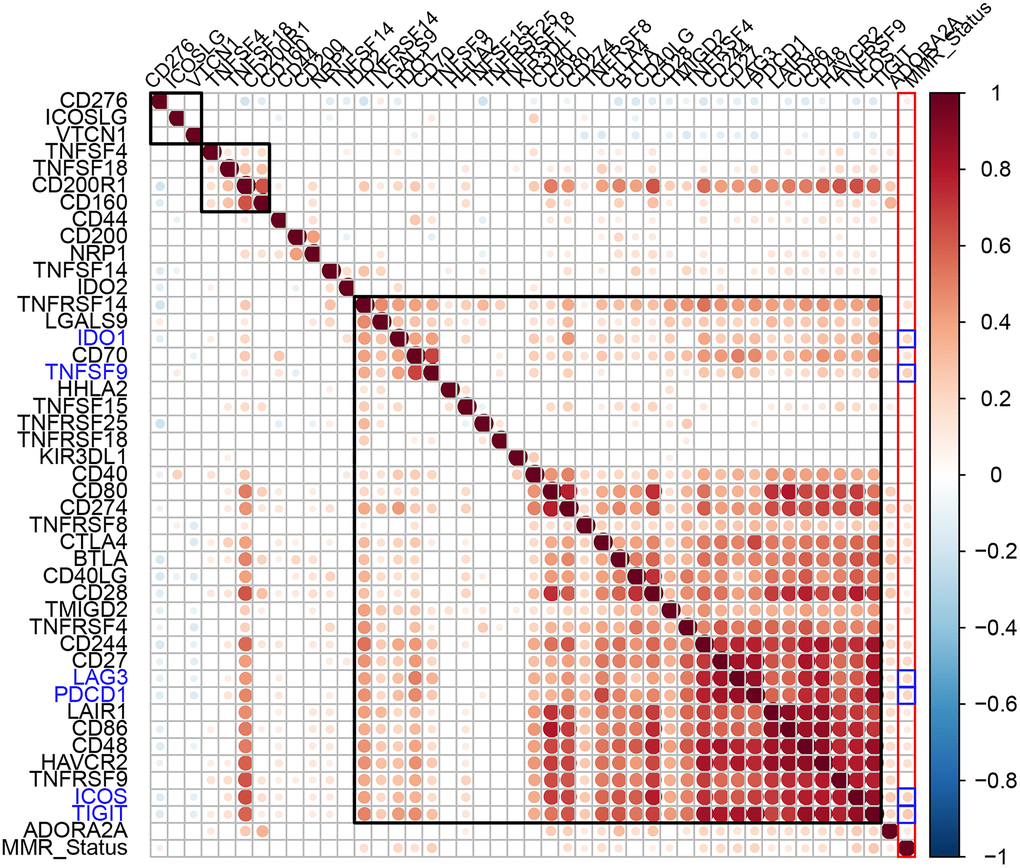
Figure 5.Association between ICGs and MMR gene mutations in EC. Spearman correlation analyses between expression of ICGs and MMR gene mutations in EC tissues. Larger dots indicate stronger correlations. Red indicates positive correlation and blue indicates negative correlation. The color intensity indicates strength of positive or negative correlations.