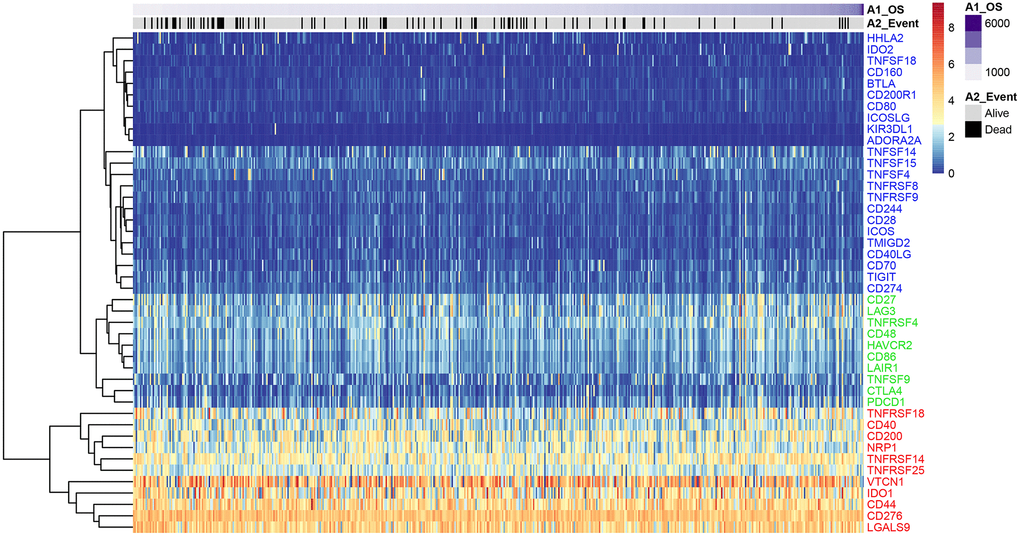
Figure 1.ICG expression in the EC samples from the TCGA dataset. Heat map shows expression levels of 47 ICGs in the TCGA-EC dataset (n = 521). Red: high expression group; green: medium expression group; blue: low expression group. The abscissa (x-axis) represents number of samples and ICGs are listed along the ordinate (y-axis).