Submit an Article
Navigate
Home
Editorial Board
Editorial Policies
Current Volume
Archive
Scientific Integrity
Publication Ethics Statements
Interviews with Outstanding Authors
Newsroom
Sponsored Conferences
Podcast
Contact
Special Collections
Submit an Article
Online ISSN: 1945-4589
Research Paper
|
Volume 13, Issue 12
|
pp. 16600–16619
Development and validation of a risk prediction model and nomogram for colon adenocarcinoma based on methylation-driven genes
Back to article
Figure 4
(4 of 8)
−
100%
+
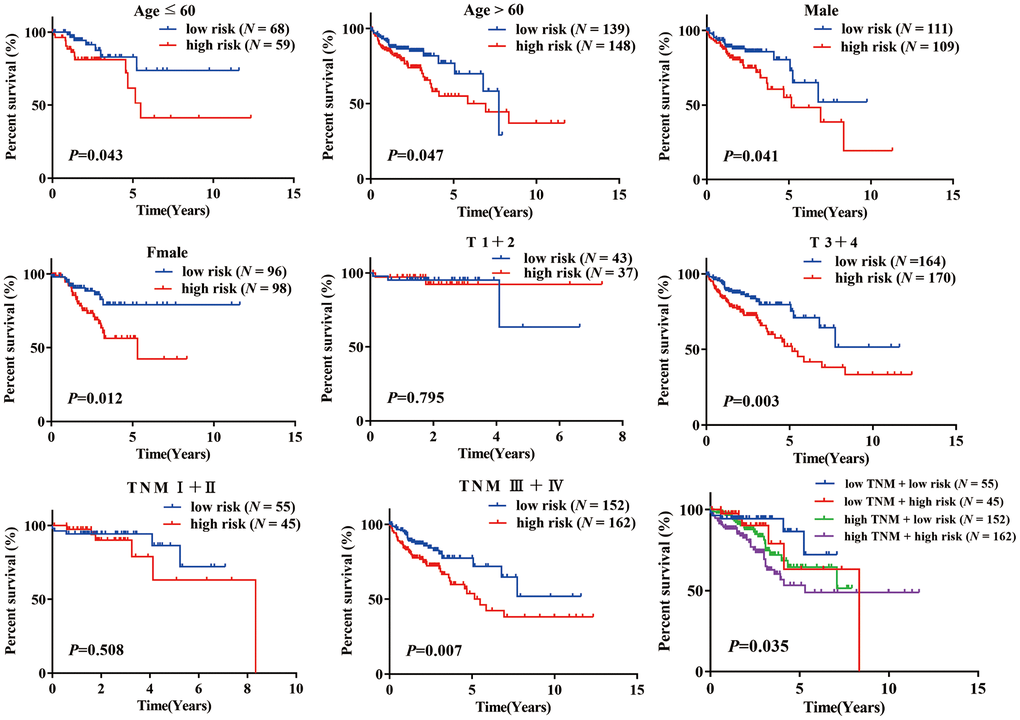
Figure 4.
K-M analysis of overall survival (OS) for patients stratified by age, gender, T stage, and TNM stage.
Figure 4 — Development and validation of a risk prediction model and nomogram for colon adenocarcinoma based on methylation-driven genes | Aging