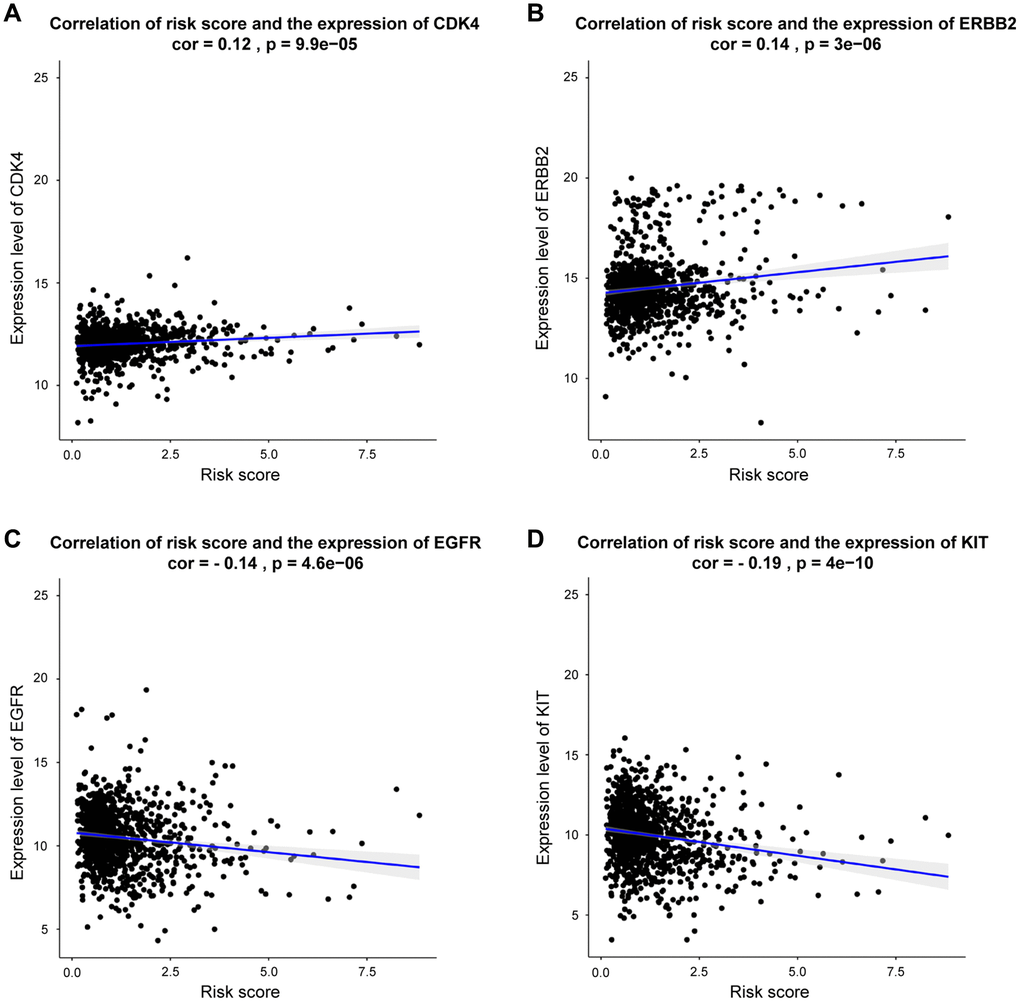
Figure 8.Correlation between risk score and genes expression for targeted treatment in BRCA. (A–D) Correlation analysis shows the results of CDK4, ERBB2, EGFR, KIT, respectively.
Figure 8 — Identification of differentially expressed genes-related prognostic risk model for survival prediction in breast carcinoma patients | Aging