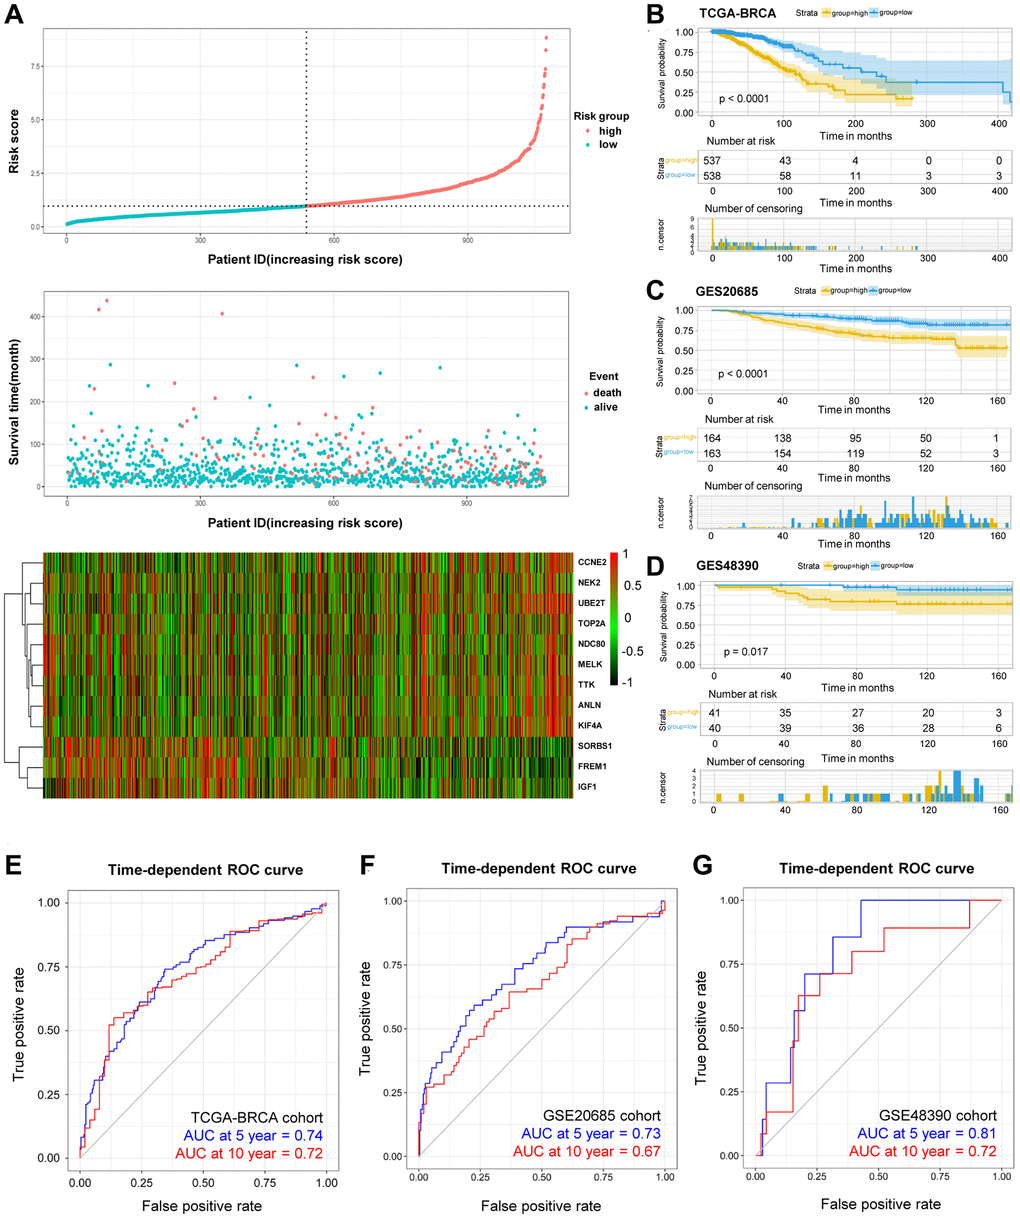
Figure 4.OS-related prognostic risk model of BRCA patients. (A) The display of prognostic risk model with risk score, patient survival time and status in TCGA-BRCA database. (B–D) The K-M survival curves of the high- and low-risk group of TCGA-BRCA cohort (B) and validation GSE20685 cohort (C) and GSE48390 cohort (D). (E–G) The prediction of 5- and 10-year survival in TCGA-BRCA cohort (E) and GSE20685 cohort (F) and GSE48390 cohort (G) by Time-ROC.