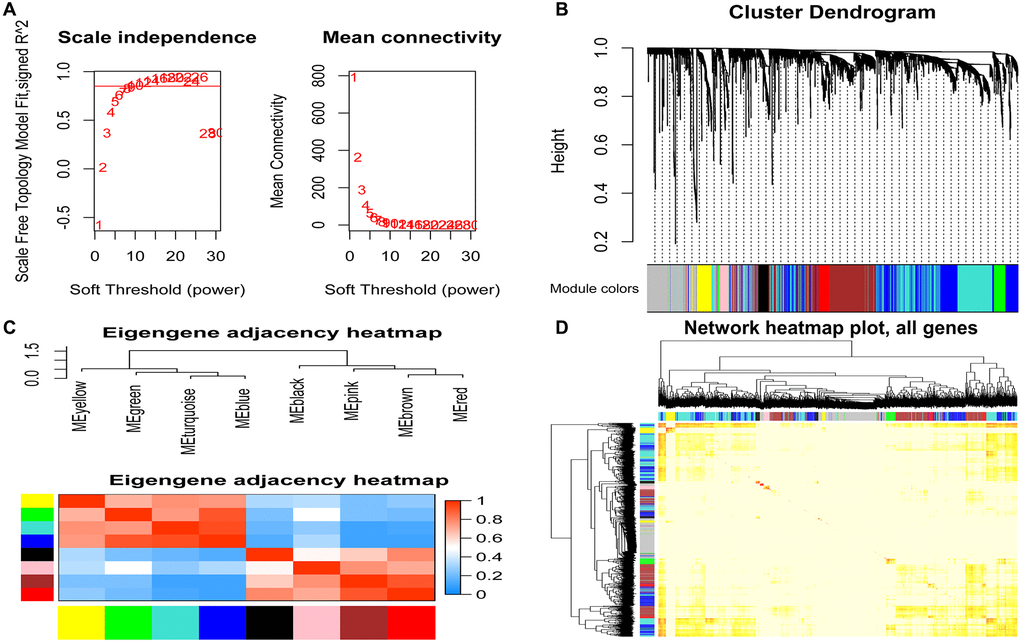
Figure 3.Identification of modules related to clinical features of acute myeloid leukemia. (A) Analysis of the soft threshold (β) through the scale-free fitting index and mean connectivity; (B) Clustering dendrogram of the DEGs through dissimilarity coefficient, which shows nine gene co-expression modules AML. Gray modules indicate no co-expression between genes; (C) The correlation heat map of WGCNA adjacent modules. The rectangles in each row and each column represent a module characteristic gene. Light blue represents low adjacency, and red represents high adjacency; (D) The TOM visualized the gene co-expression network's heat map in the module. In the TOM map, light colors indicate topological overlap. Dark colors indicate a higher degree of topological overlap. The gene tree diagram and corresponding modules are displayed on the upper left of the TOM diagram. The intersection of the two rectangles indicates the topological overlap in the Blue module. DEGs: differentially expressed genes; TOM: topological overlap matrix.