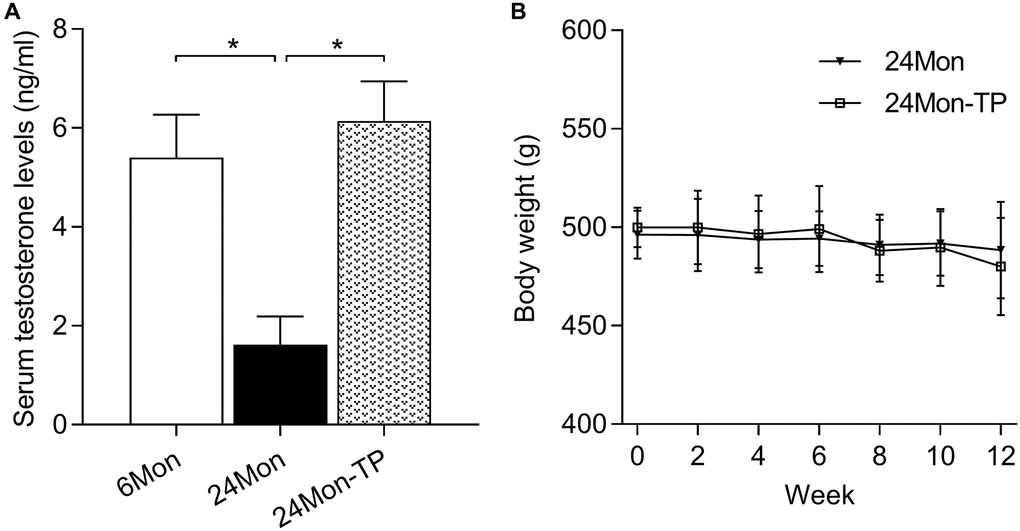
Figure 1.Serum testosterone levels and body weight measurements. (A) Serum testosterone levels recorded in the experimental animal groups. (B) Summary of body weight measurements. Data are expressed as the mean ± S.D. (n = 8/group). *P < 0.01 (Bonferroni test).