Submit an Article
Navigate
Home
Editorial Board
Editorial Policies
Current Volume
Archive
Scientific Integrity
Publication Ethics Statements
Interviews with Outstanding Authors
Newsroom
Sponsored Conferences
Podcast
Contact
Special Collections
Submit an Article
Online ISSN: 1945-4589
Research Paper
|
Volume 13, Issue 13
|
pp. 17914–17929
Roxadustat for the treatment of anemia in patients with chronic kidney diseases: a meta-analysis
Back to article
Figure 2
(2 of 9)
−
100%
+
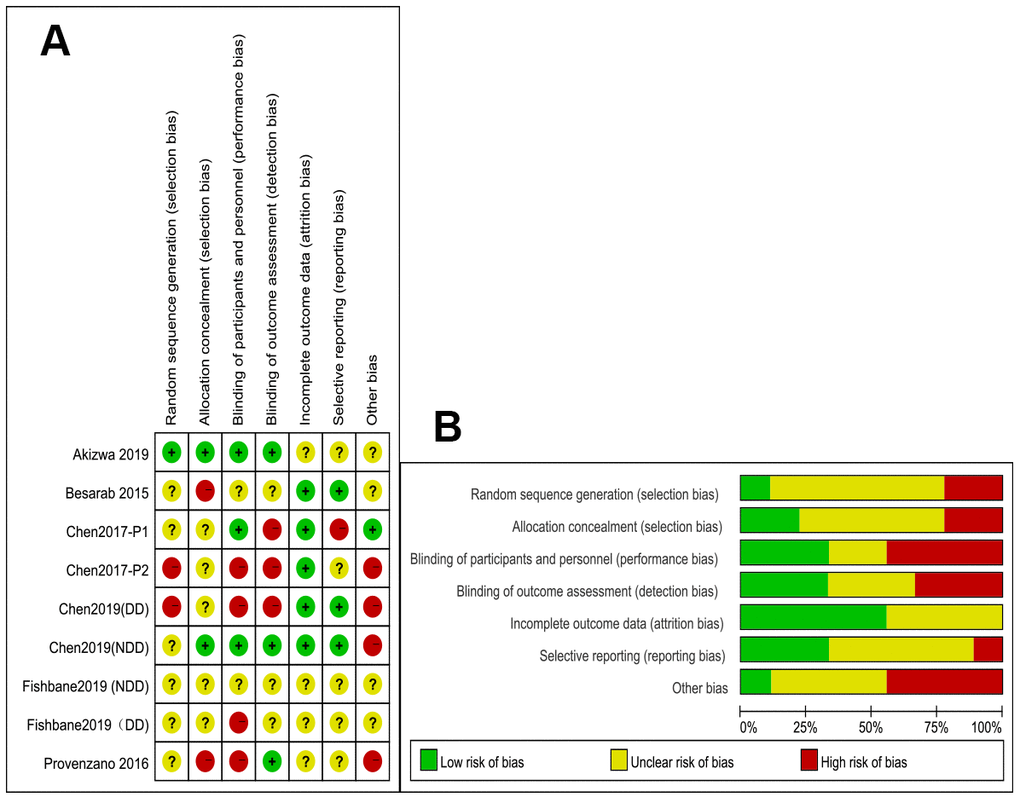
Figure 2.
(
A
) Summary of the quality assessment of the included studies; (
B
) Quality assessment graph.
Figure 2 — Roxadustat for the treatment of anemia in patients with chronic kidney diseases: a meta-analysis | Aging