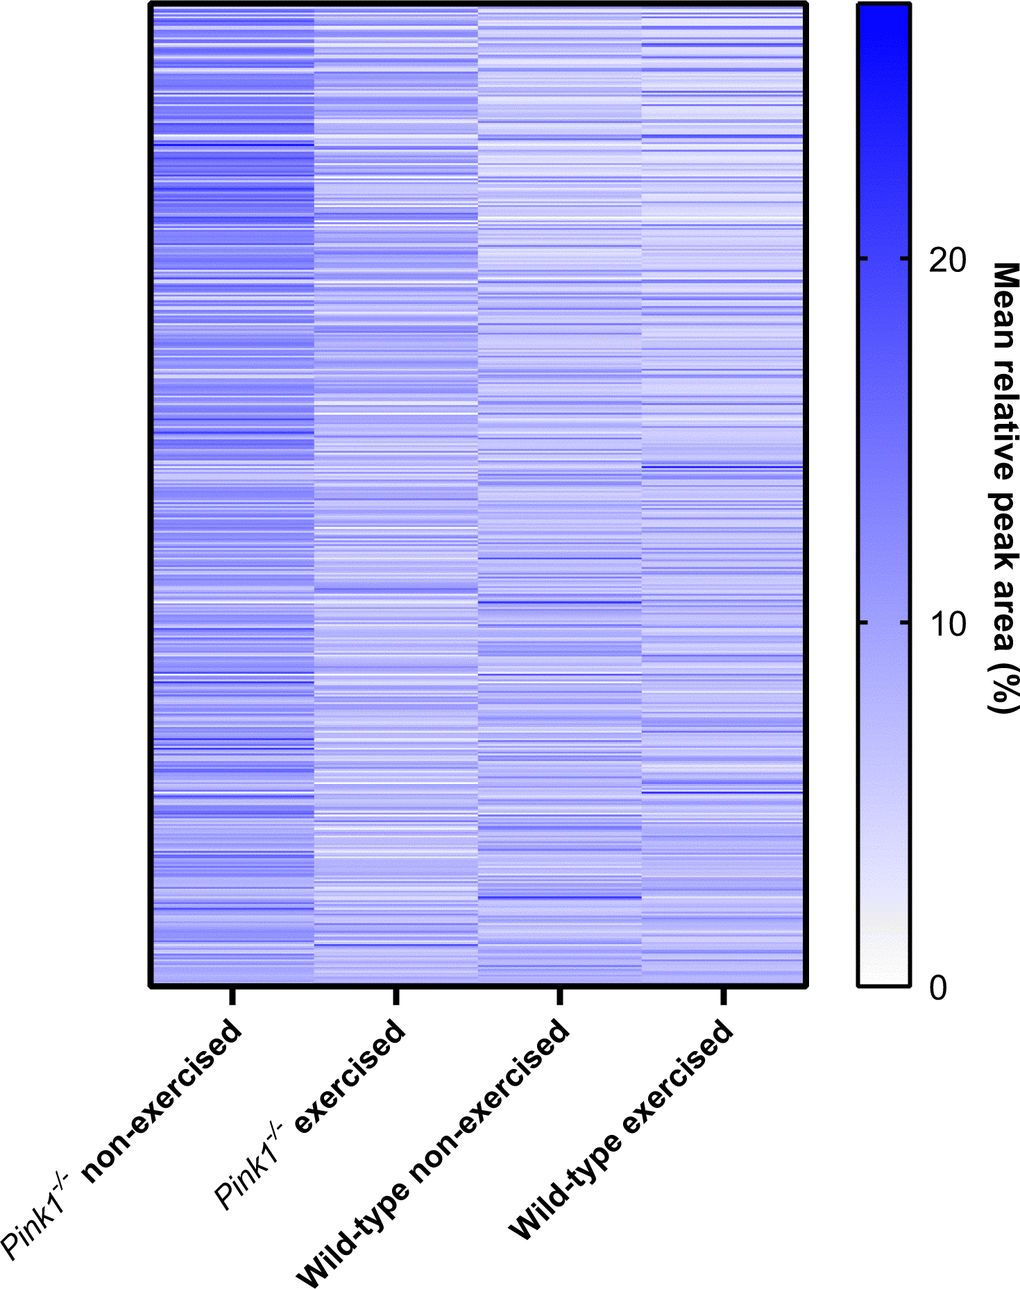
Figure 4.Heat map of protein expression levels (for proteins identified among all groups), determined by label-free mass spectrometry of mitochondrial fractions. Qualitatively, the identified Pink1- exercised fly proteome more closely resembles the two WT fly proteomes than does the Pink1 non-exercised fly proteome.