Submit an Article
Navigate
Home
Editorial Board
Editorial Policies
Current Volume
Archive
Scientific Integrity
Publication Ethics Statements
Interviews with Outstanding Authors
Newsroom
Sponsored Conferences
Podcast
Contact
Special Collections
Submit an Article
Online ISSN: 1945-4589
Research Paper
|
Volume 13, Issue 11
|
pp. 15595–15619
Single-cell RNA sequencing of human femoral head
in vivo
Back to article
Figure 5
(5 of 9)
−
100%
+
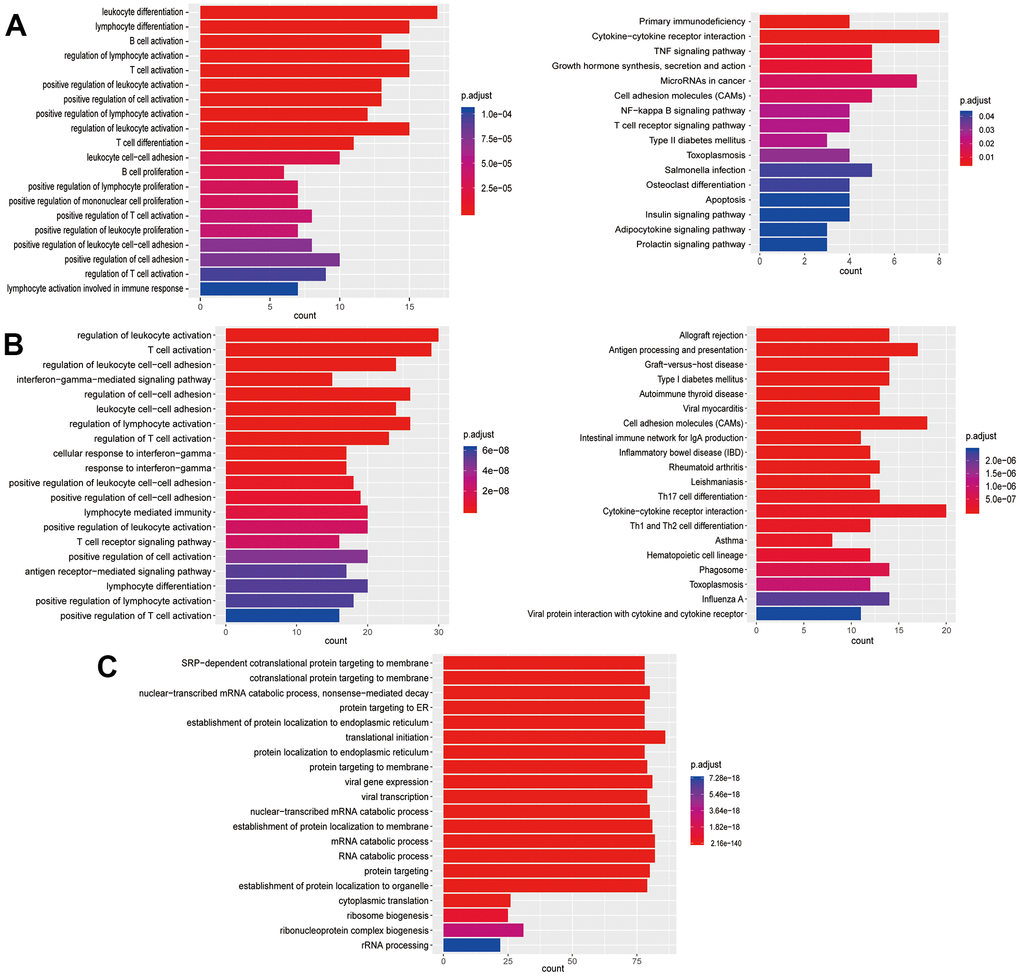
Figure 5.
Enrichment analysis of subtypes in T cells (T1-T3).
(
A
) GO (left) and KEGG (right) enrichment analysis of DEGs in T1. (
B
) GO (left) and KEGG (right) enrichment analysis of DEGs in T2. (
C
) GO enrichment analysis of DEGs in T3.