Submit an Article
Navigate
Home
Editorial Board
Editorial Policies
Current Volume
Archive
Scientific Integrity
Publication Ethics Statements
Interviews with Outstanding Authors
Newsroom
Sponsored Conferences
Podcast
Contact
Special Collections
Submit an Article
Online ISSN: 1945-4589
Research Paper
|
Volume 13, Issue 12
|
pp. 16024–16042
Identification of microenvironment related potential biomarkers of biochemical recurrence at 3 years after prostatectomy in prostate adenocarcinoma
Back to article
Figure 6
(6 of 9)
−
100%
+
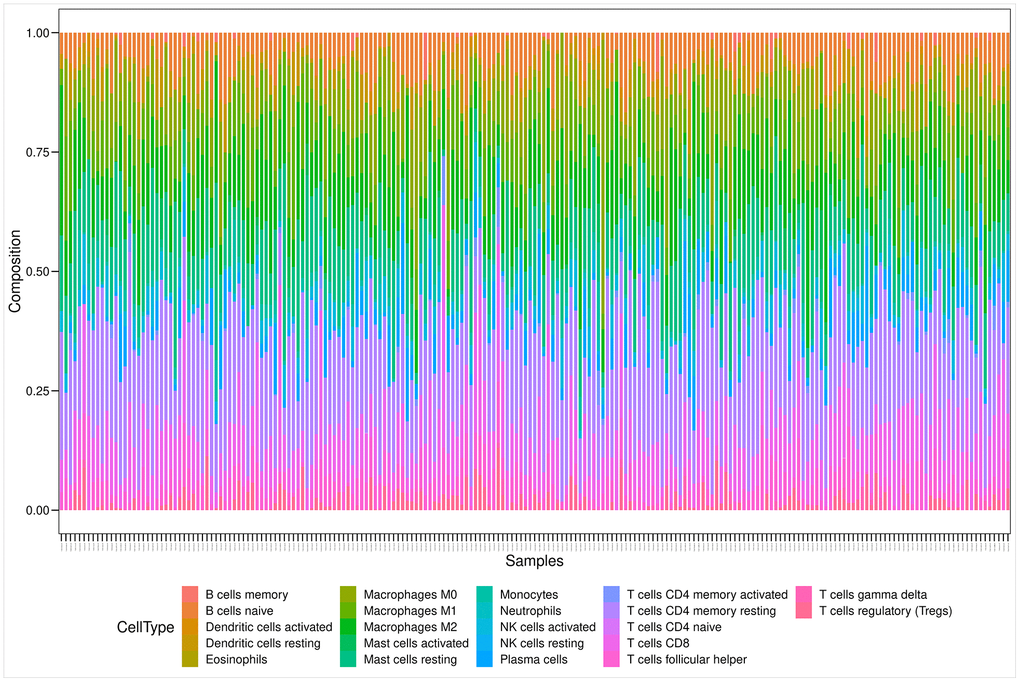
Figure 6.
Bar plot showing the proportion of 22 kinds of TIC profiles in PRAD tumor samples.
Rows and columns represent immune cell compositions and samples, respectively.