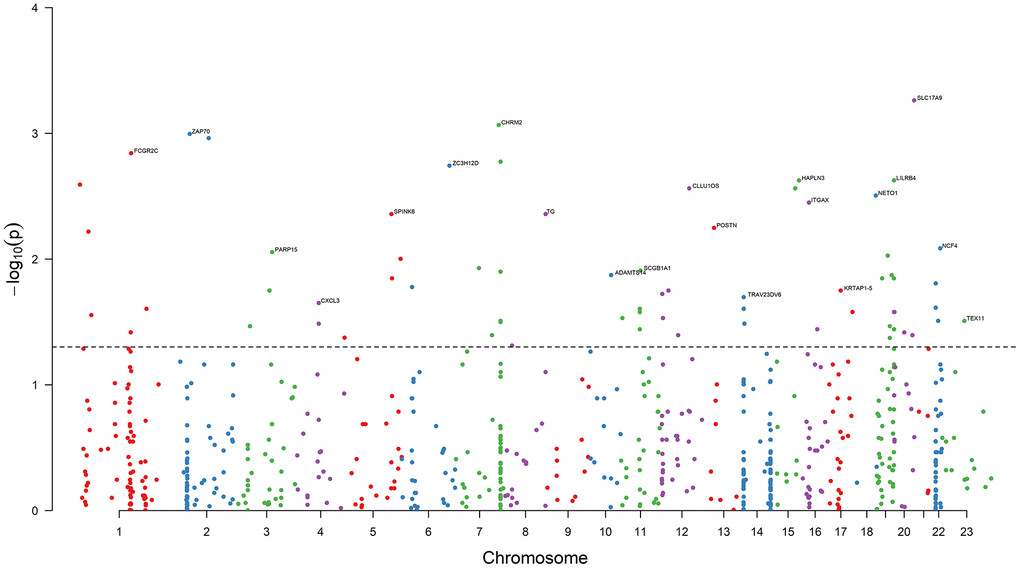
Figure 3.Results of association analysis. The dashed black line is the bound of P = 0.05. 68 DEGs are associated with the PRAD BCR (P < 0.05). The top genes with the minimum P value on each chromosome are annotated. Chromosome 23 is denoted Chromosome X.