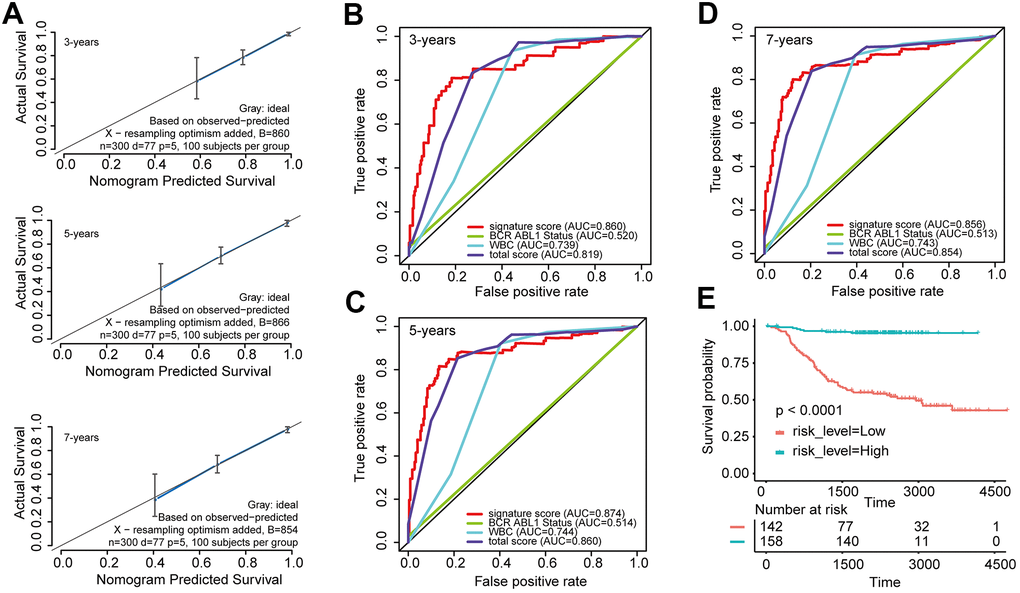
Figure 3.Evaluated the predictive accuracy and discriminative ability of the nomogram (A) Calibration curves of the nomogram for the estimation of survival rates at 3, 5, and 7 years. (B–D) ROC curves at 3, 5, and 7 years according to the nomogram and lncRNA signature score. (E) Kaplan-Meier curves of OS according to the total risk score.