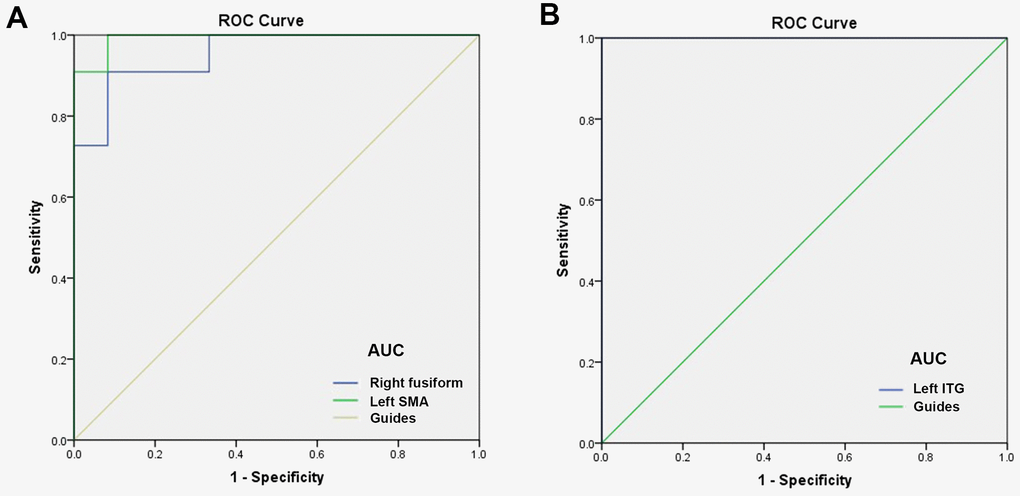
Figure 4.ROC curve analysis of the mean DC values for altered brain regions. (A) The AUC were 0.955, (p<0.0001; 95% CI: 0.877-1.000) for right fusiform, and left SMA 0.992, (p<0.0001; 95% CI: 0.968-1.000). (B) The AUC of left ITG were 1.000, (p<0.0001; 95% CI: 1.000-1.000). Abbreviations: ROC, receiver operating characteristic; AUC, area under the curve;ITG, inferior temporal gyrus; SMA, supplementary motor area.