Submit an Article
Navigate
Home
Editorial Board
Editorial Policies
Current Volume
Archive
Scientific Integrity
Publication Ethics Statements
Interviews with Outstanding Authors
Newsroom
Sponsored Conferences
Podcast
Contact
Special Collections
Submit an Article
Online ISSN: 1945-4589
Research Paper
|
Volume 13, Issue 11
|
pp. 15433–15443
Galectin-3/adiponectin as a new biological indicator for assessing the risk of type 2 diabetes: a cross-sectional study in a community population
Back to article
Figure 3
(3 of 3)
−
100%
+
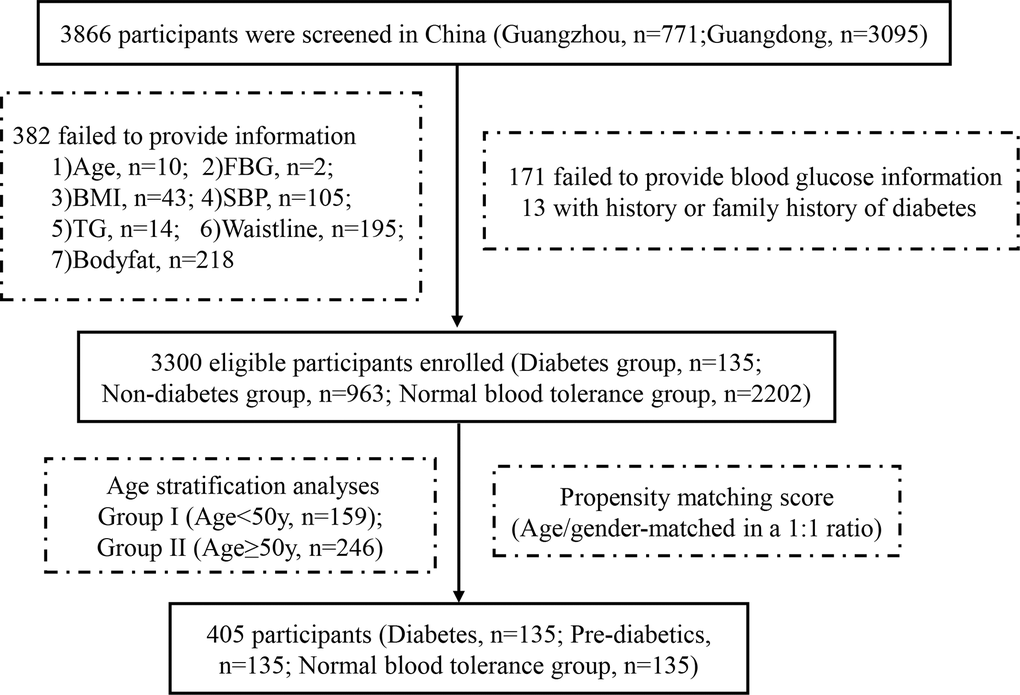
Figure 3.
Flow diagram of participants in the study.