Submit an Article
Navigate
Home
Editorial Board
Editorial Policies
Current Volume
Archive
Scientific Integrity
Publication Ethics Statements
Interviews with Outstanding Authors
Newsroom
Sponsored Conferences
Podcast
Contact
Special Collections
Submit an Article
Online ISSN: 1945-4589
Research Paper
|
Volume 13, Issue 11
|
pp. 15413–15432
Sex-related differences in the efficacy of immune checkpoint inhibitors in malignancy: a systematic review and meta-analysis
Back to article
Figure 5
(5 of 6)
−
100%
+
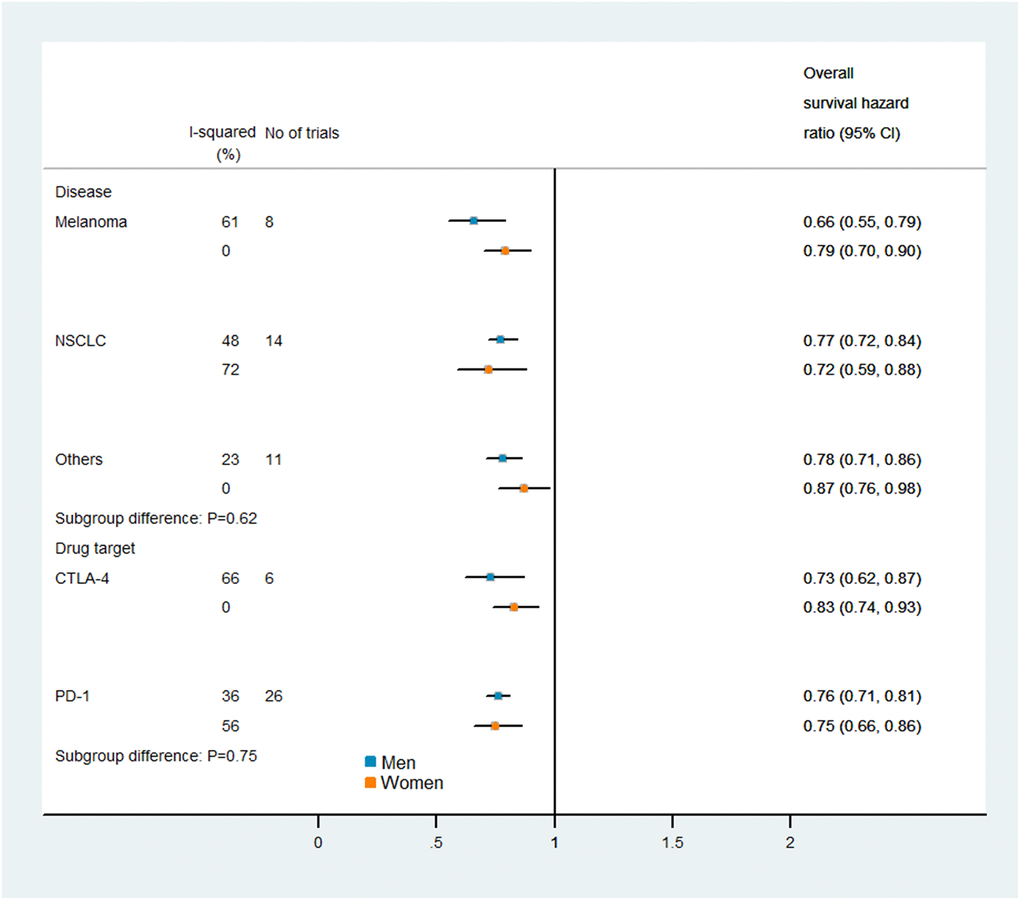
Figure 5.
Subgroup analyses of overall survival in patients assigned to the intervention and control groups.