Submit an Article
Navigate
Home
Editorial Board
Editorial Policies
Current Volume
Archive
Scientific Integrity
Publication Ethics Statements
Interviews with Outstanding Authors
Newsroom
Sponsored Conferences
Podcast
Contact
Special Collections
Submit an Article
Online ISSN: 1945-4589
Research Paper
|
Volume 13, Issue 11
|
pp. 15366–15383
The effects of psyllium husk on gut microbiota composition and function in chronically constipated women of reproductive age using 16S rRNA gene sequencing analysis
Back to article
Figure 7
(7 of 7)
−
100%
+
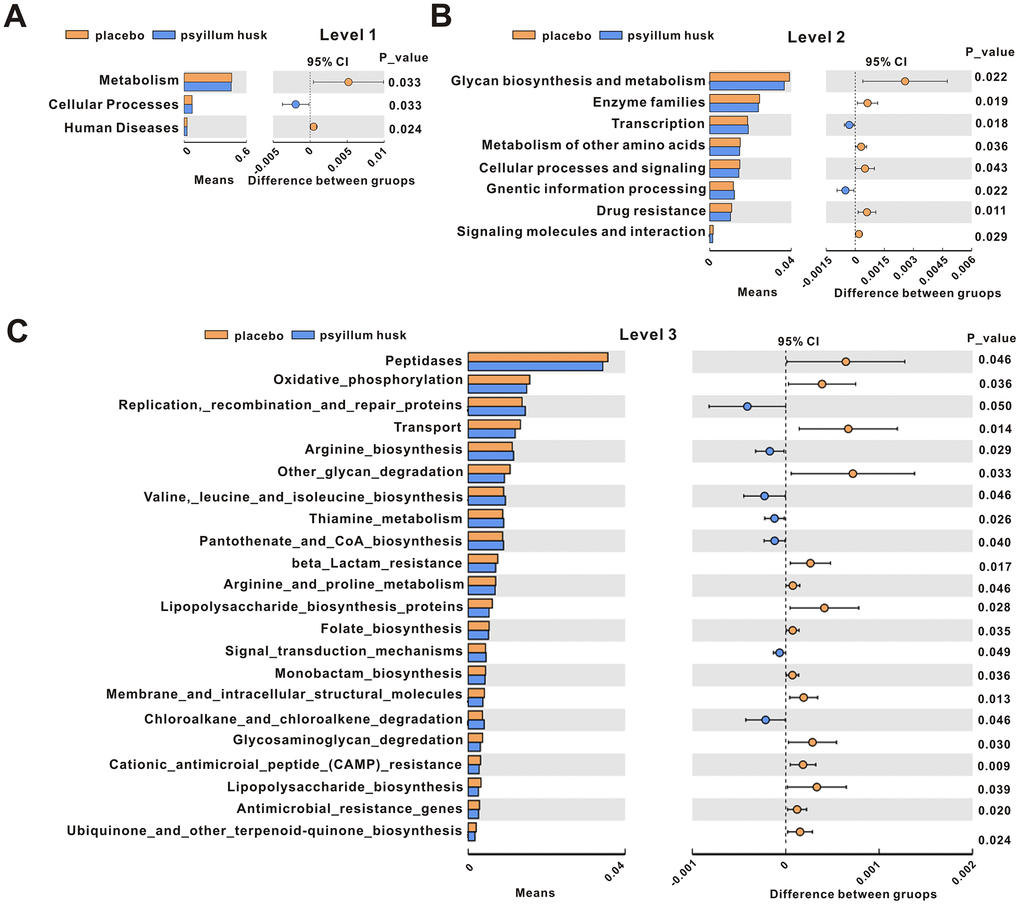
Figure 7.
KEGG signaling pathways were compared between the placebo and psyllium husk groups at levels 1 (
A
), 2 (
B
), and 3 (
C
), as analyzed by Student’s
t
test (
P
< 0.05). CI: confidence interval.