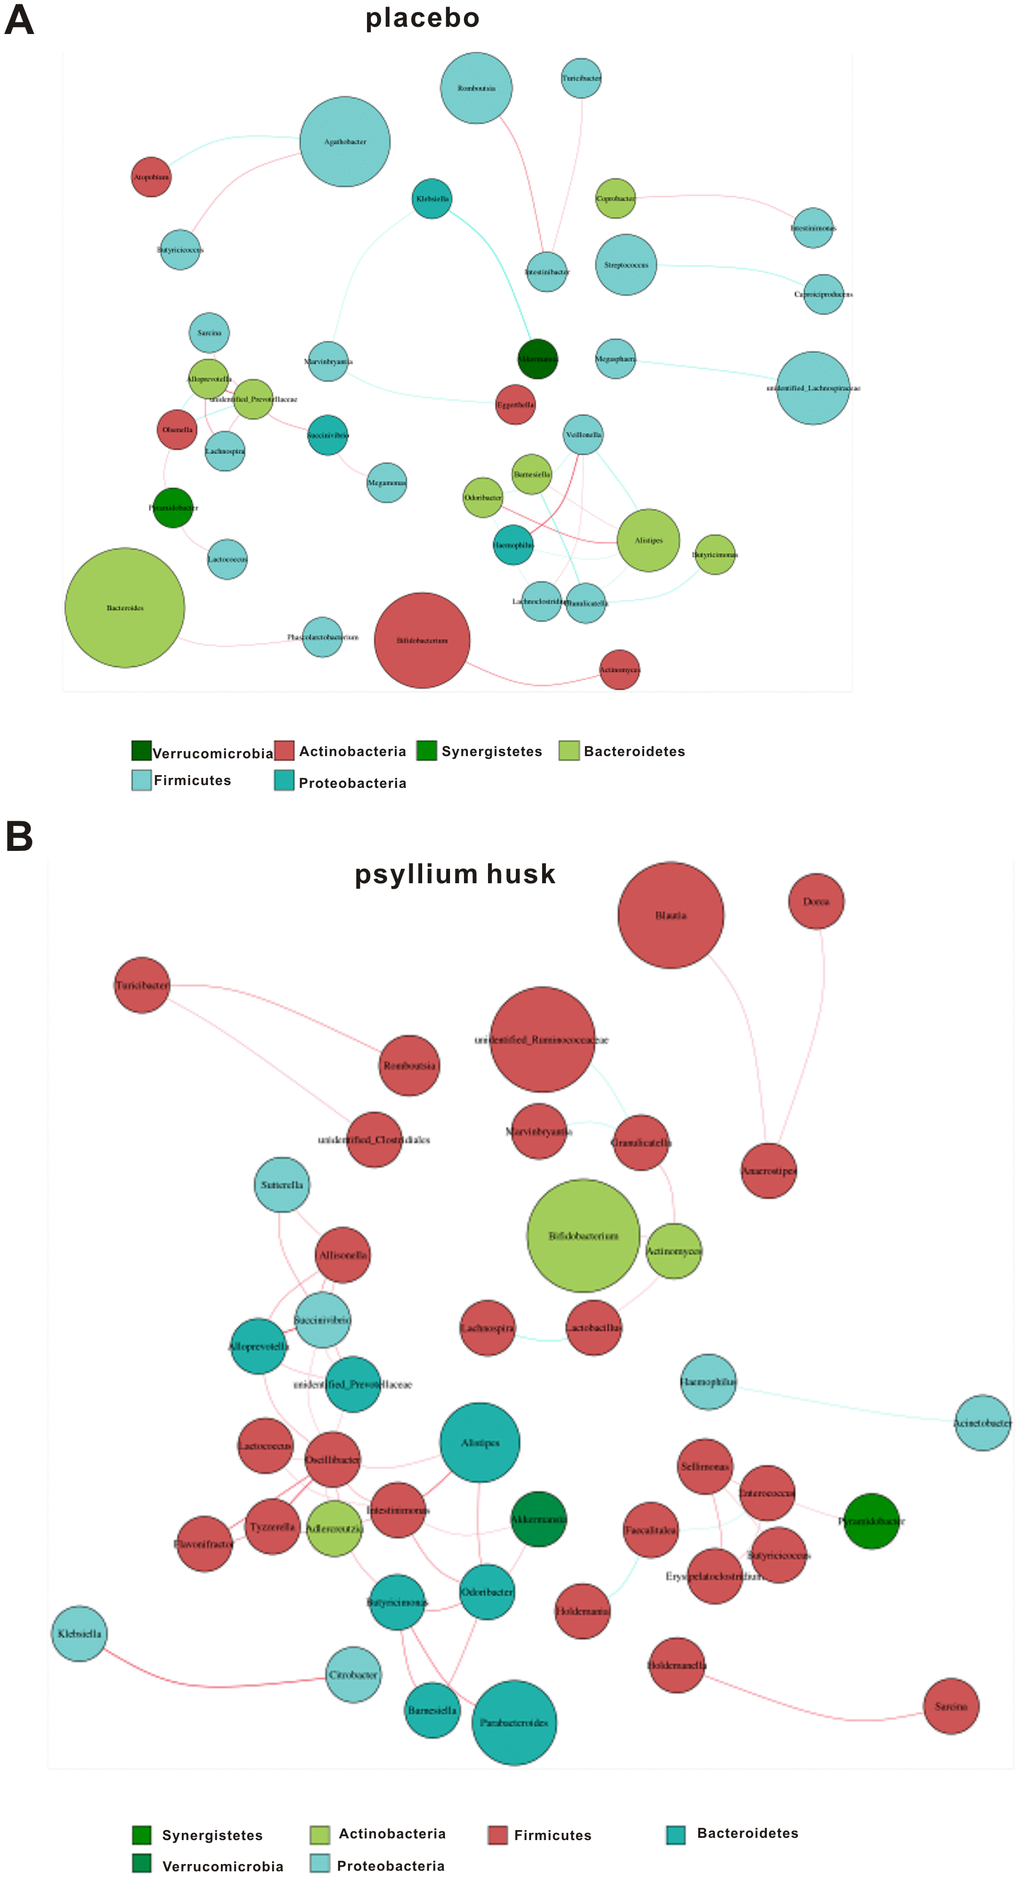
Figure 5.Correlation network analysis in the placebo (A) and psyllium husk (B) groups. Different nodes represent different genera, and the node size represents the average relative abundance of each genus. Thickness of the connection between each nodes is positively correlated with the absolute value of the correlation coefficient of species interaction (red: positive correlation; blue: negative correlation).