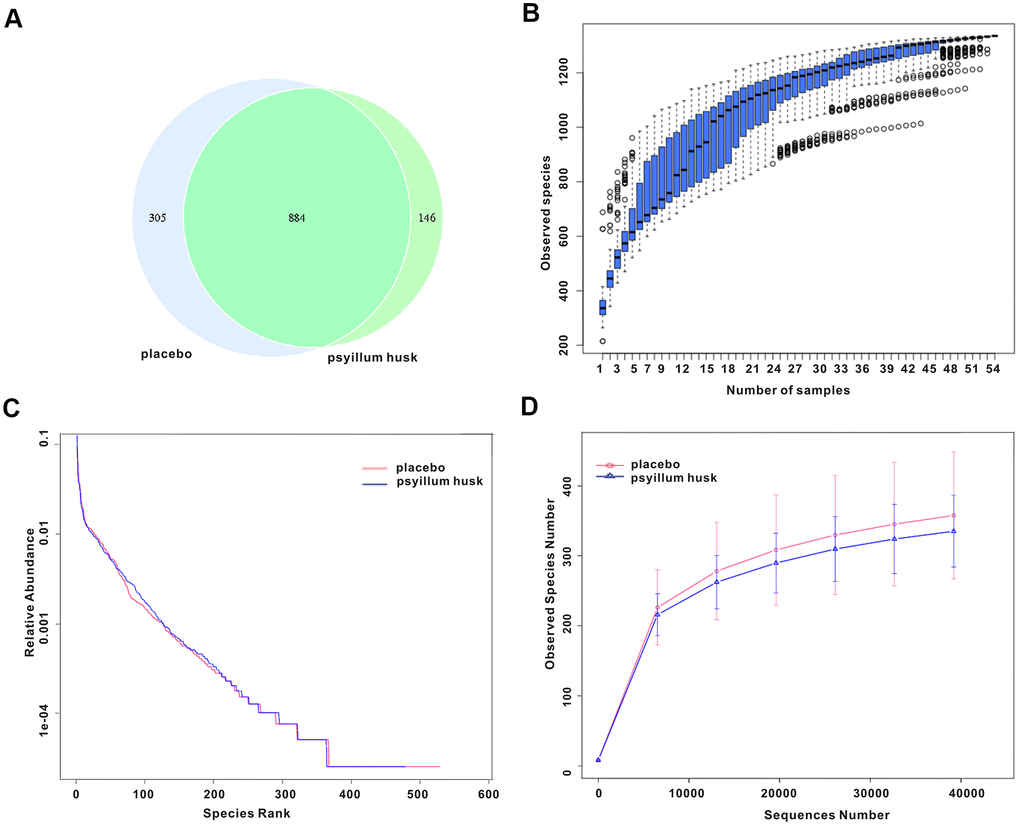
Figure 1.Species abundance and bacterial diversity in both groups. (A) The Venn diagram indicates overlap of OTUs between the two groups. (B) The species accumulation boxplot displays species richness. (C, D) Rank abundance curve analysis and rarefaction curve analysis were used to show bacterial diversity and species abundance.