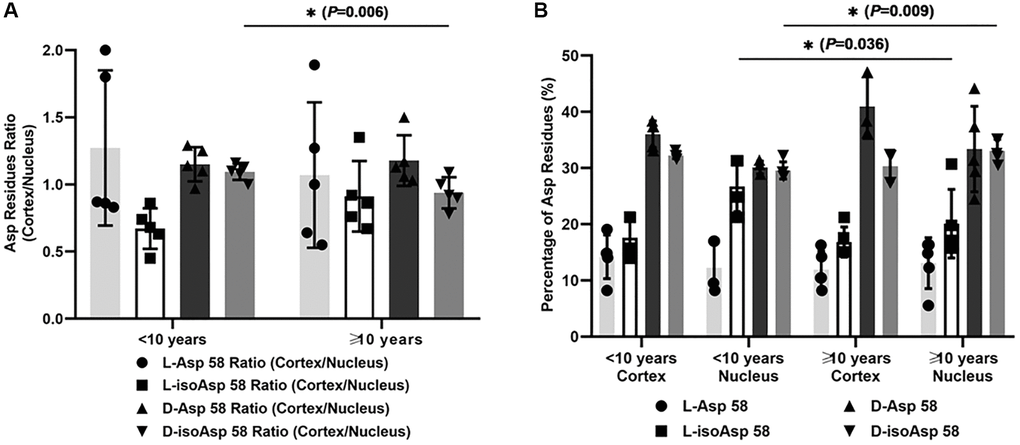
Figure 2.(A) The cortex/nucleus ratio of each Asp 58 isomer in αA-crystallin of two subgroups of DC lenses according to the duration of diabetes (less than ten years and more than ten years). (B) The percentage of each Asp 58 isomer in αA-crystallin of two subgroups of DC lenses according to the duration of diabetes (less than ten years and more than ten years).