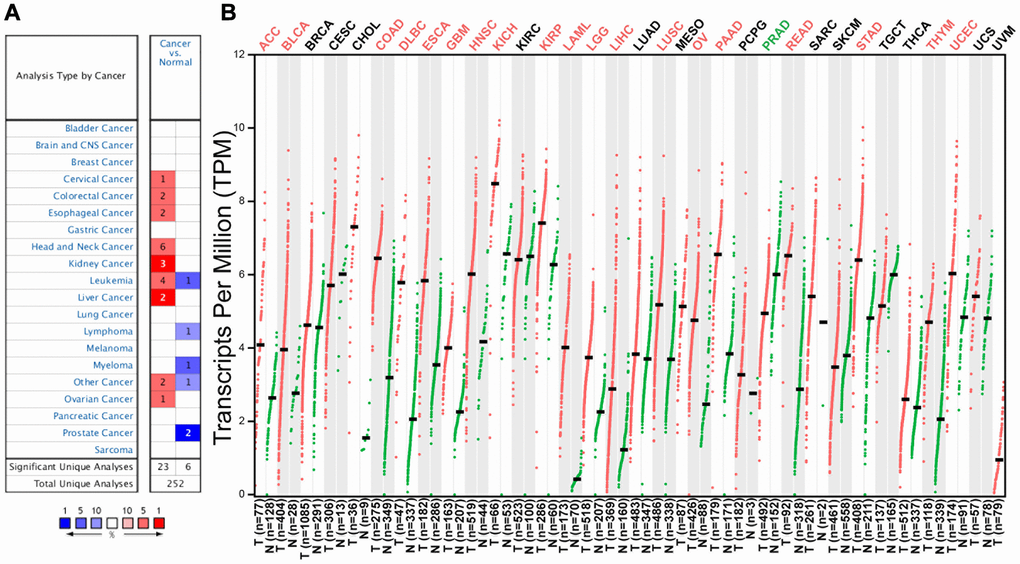
Figure 1.C12orf75 expression levels in different human cancers and survival curves comparing the high and low expression of C12orf75 in different types of cancers in the TCGA database. (A) Increased or decreased expression of C12orf75 in different cancer tissues compared with normal tissues in ONCOMINE. The number in each cell is the number of datasets. (B) C12orf75 expression profile across all tumor samples and paired normal tissues determined by GEPIA. The red and green letters describe an increase and a decrease in cancer, respectively. C12orf75, chromosome 12 open reading frame 75; GEPIA, Gene Expression Profiling Interactive Analysis.