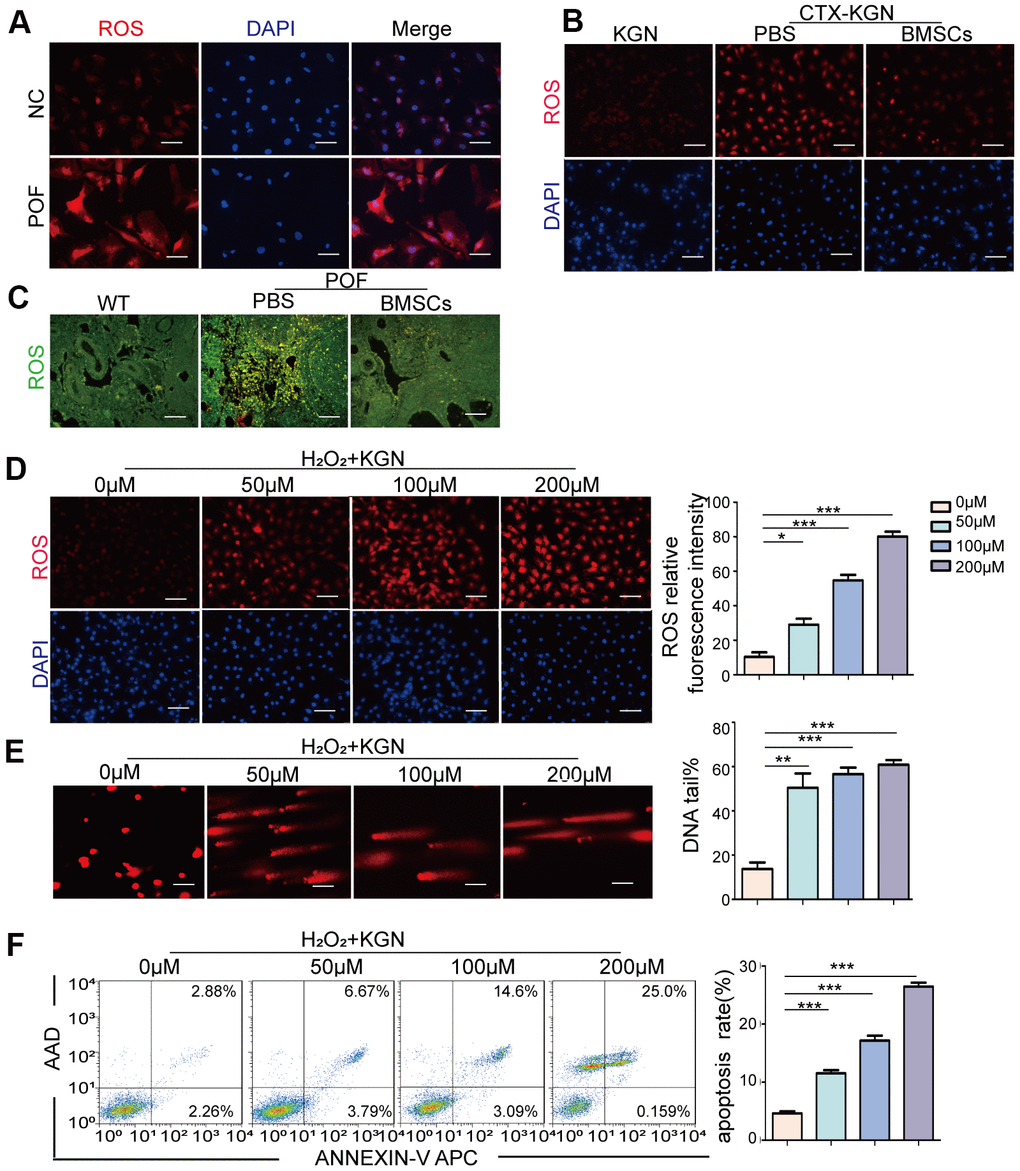
Figure 3.Oxidative stress induces DNA damage and apoptosis in GCs. (A) ROS of GCs of women with normal ovarian function and POF patients was assessed via DHE probes. Scale bar: 100μm. (B) ROS in the KGN, CTX-KGN-PBS and CTX-KGN-BMSCs groups were assessed using DHE probes. Scale bar: 100μm. (C) ROS in the ovaries of the WT, POF-PBS and POF-BMSCs groups were assessed using DCFH-DA probes. Scale bar: 100μm. (D) Cells were treated with 0 μM to 200 μM H2O2 for 1 hour. Total production of ROS was assessed using DHE probes. Scale bar: 100μm. (E) The DNA damage of cells treated with H2O2 was measured via comet assay. Scale bar: 100μm. Comparison of the tail of DNA between the groups. (F) Apoptosis of H2O2+KGN was assessed using Annexin V staining. Comparison of apoptotic rates between the groups.
(G) H2O2+KGN were harvested at the indicated time points for γ-H2AX staining. Positive cells in each group and the frequency of cells with foci were counted. Scale bar: 10μm. (H) KGN cells transfected with GFP-TRDMT1 (WT, G155V, and E63K mutant) were stimulated with H2O2, and their cell localization was observed. Scale bar: 50μm.Comparison of the nucleus/cytoplasm ratio between the two groups. *P<0.05, **p<0.01, and ***p<0.001. Statistical significance was determined using two-tailed t-tests for two groups and ANOVA for multiple comparisons. All values are means ± SD.