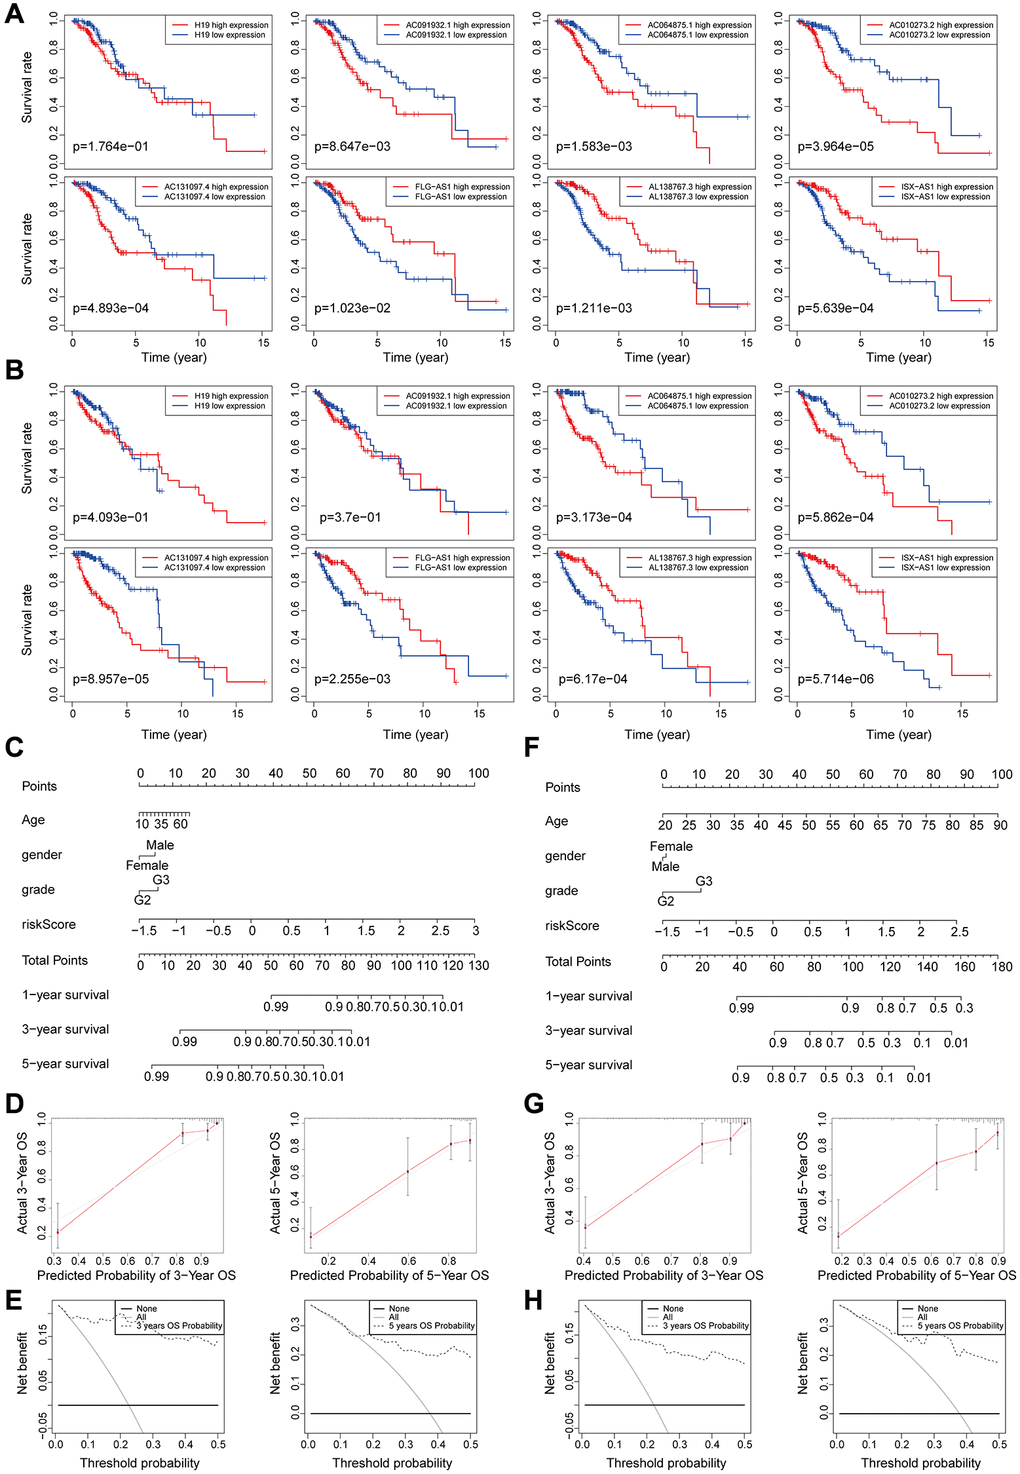
Figure 5.(A–B) Kaplan-Meier survival curves analysis for the eight genomic instability-associated lncRNAs using the training set (A) and validation set (B) of patients with low-grade glioma. (C–E) Nomograms for the eight genomic instability-associated lncRNAs for each factor in the training set, predictions of patient survival at 1, 3, and 5 years. Nomograms were evaluated using calibration curves and DCA curves. (F–H) Plot nomogram plots in the validation set and evaluation of nomograms using calibration curves and DCA curves.