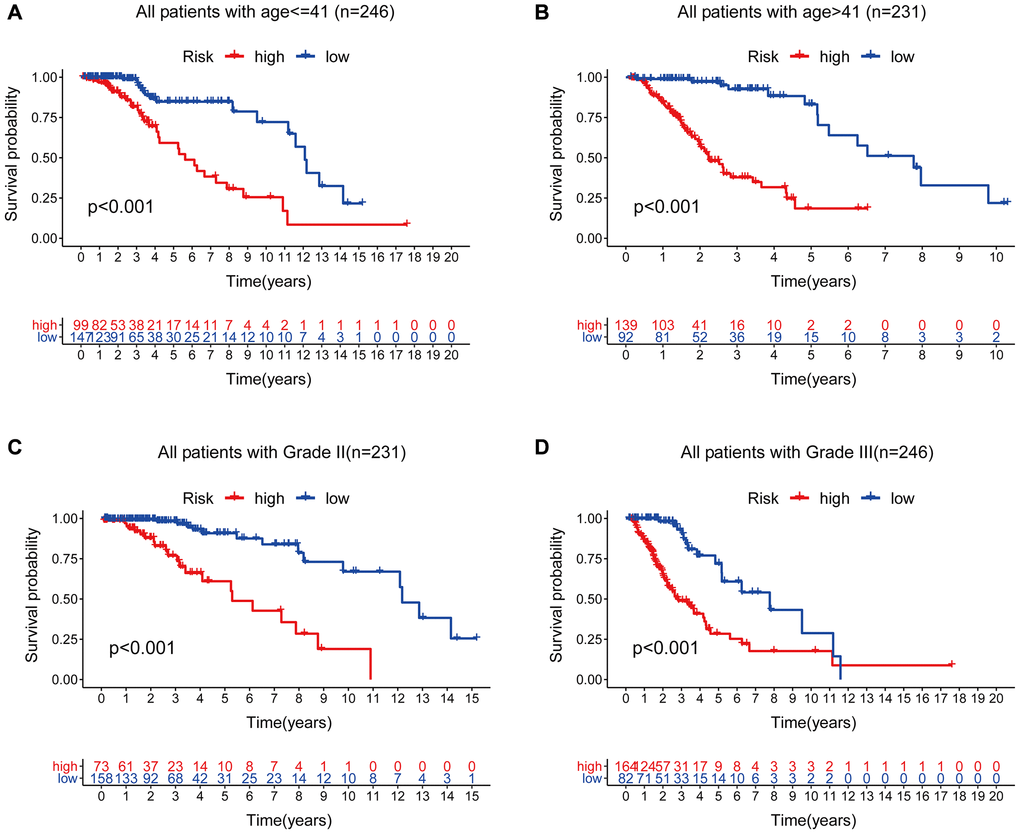
Figure 11.Stratified analysis by age and tumor grade. (A–B) Kaplan-Meier curve analysis of OS in the high- and low-risk groups for patients in the two age groups. (< = 41 and >41 years). (C–D) Kaplan-Meier curve analysis for OS in high- and low-risk groups for Grade II and Grade III groups.