Submit an Article
Navigate
Home
Editorial Board
Editorial Policies
Current Volume
Archive
Scientific Integrity
Publication Ethics Statements
Interviews with Outstanding Authors
Newsroom
Sponsored Conferences
Podcast
Contact
Special Collections
Submit an Article
Online ISSN: 1945-4589
Research Paper
|
Volume 13, Issue 11
|
pp. 15139–15150
Dexmedetomidine inhibits unstable motor network in patients with primary motor area gliomas
Back to article
Figure 5
(5 of 5)
−
100%
+
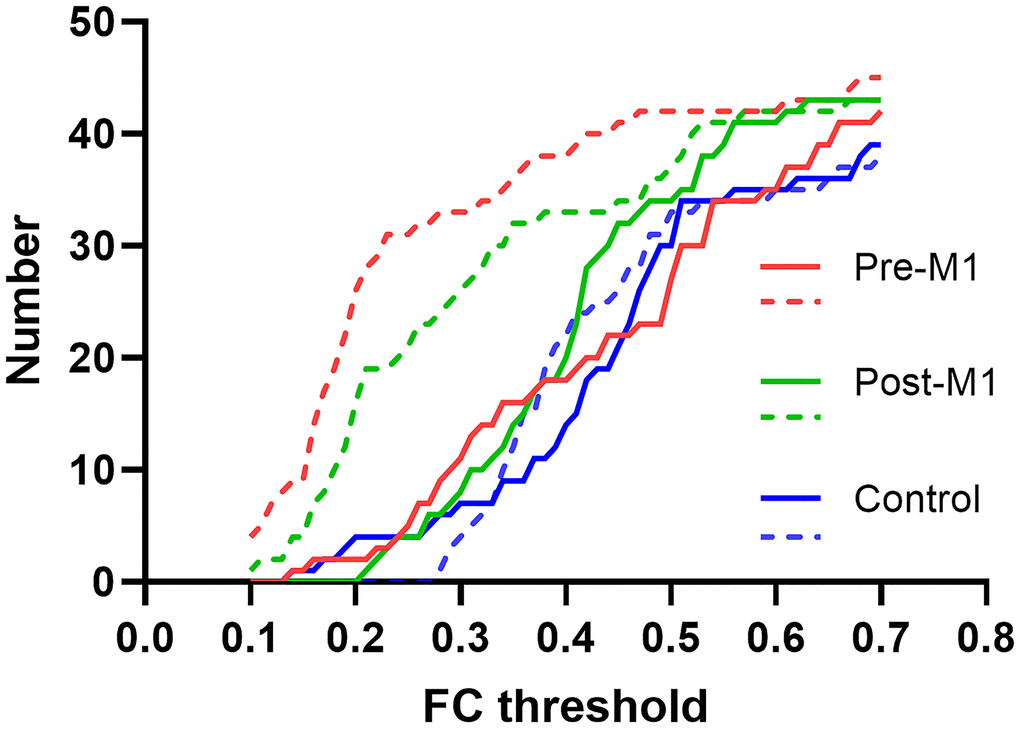
Figure 5.
FC threshold and the corresponding individual FC numbers in pre-M1, post-M1 and control groups.
The solid and dashed line indicated FC before and after sedation separately.