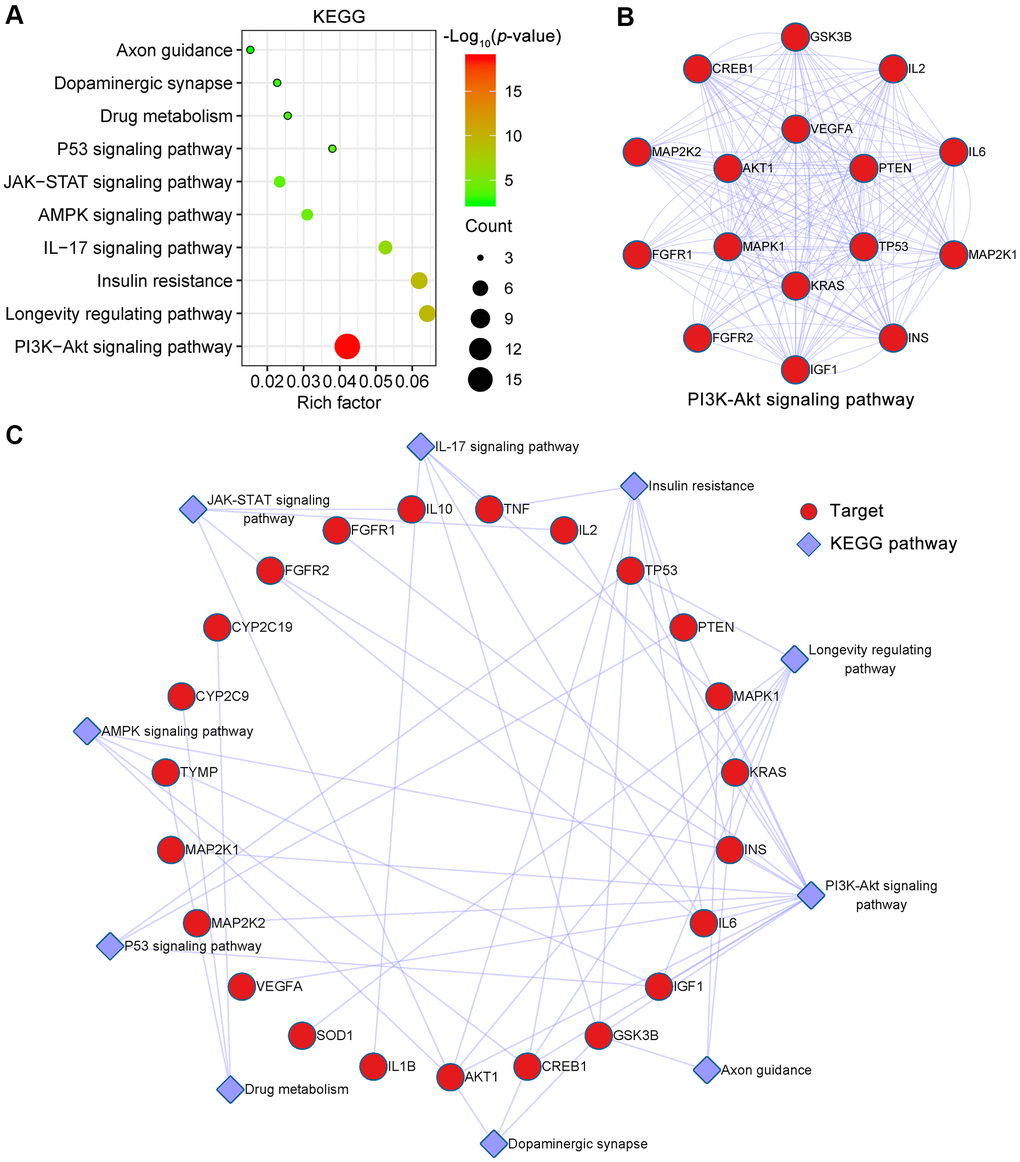
Figure 6.KEGG pathway enrichment analysis of EMO against depression. (A) The top 10 KEGG pathways are presented in the bubble chart. The X-axis represents the rich factor, bubble size represents the count of targets enriched in terms and the color represents the p value. (B) The PPI network of targets involved in the PI3K-Akt signaling pathway. (C) KEGG pathway-target network diagram of EMO treatment of depression. Red nodes represent target proteins and blue diamond nodes represent enriched KEGG pathways.