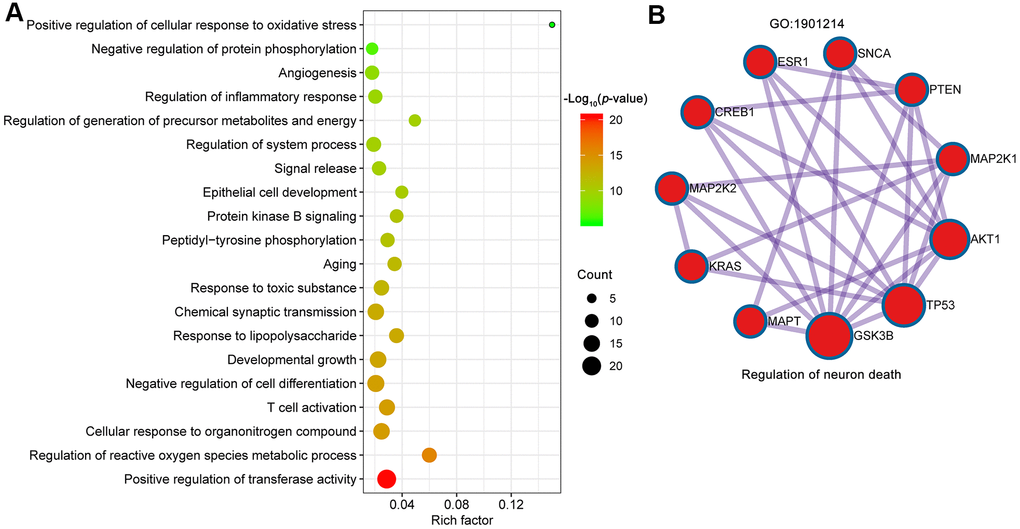
Figure 5.Biological processes of GO enrichment analysis. (A) Top 20 bubble chart of biological process of GO enrichment analysis. The X-axis represents the rich factor, bubble size represents the count of targets enriched in terms and the color represents the p value. (B) The regulation of neuron death (GO:1901214) was identified by MCODE algorithm.