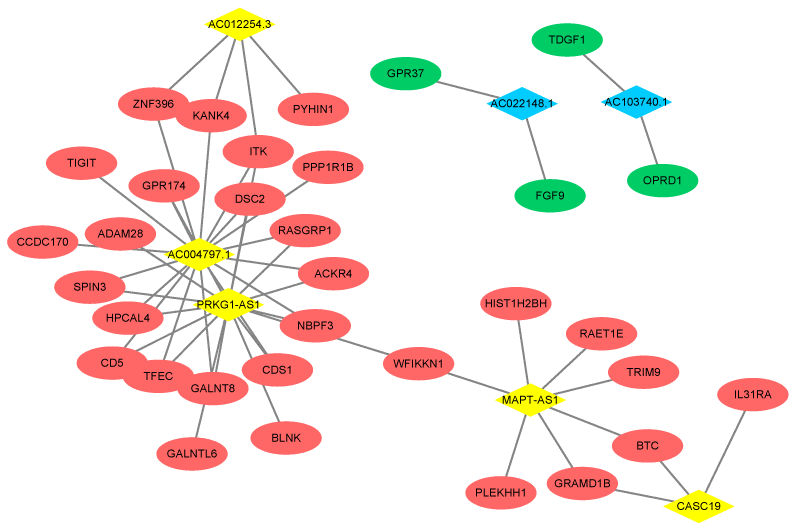
Figure 4.Co-expression network of DEGs and DElncRNAs. The red ellipse represent upregulated gene and the green ellipse represent downregulated gene. The yellow rhombus represents upregulated lncRNA and blue rhombus represents downregulated lncRNA. The lines between the genes and lncRNAs indicate that there is a co-expression relationship between the two.