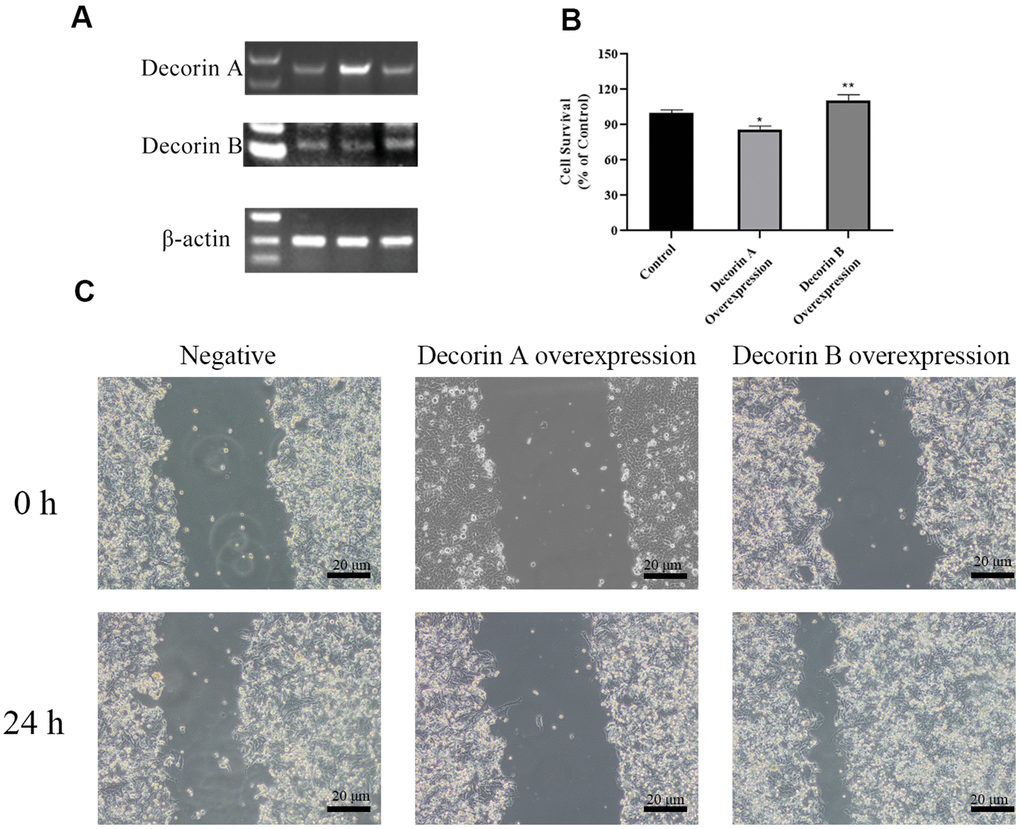
Figure 3.The effects of decorin A and decorin B on the BxPC-3 cells. (A) Semi-quantitative RT PCR analysis for decorin A and B after transfected (B); Cell viability analysis by MTT assay after the overexpression of decorin A and B; (C) Cell migration analysis by the scratch wound assay after the overexpression of decorin A and B.