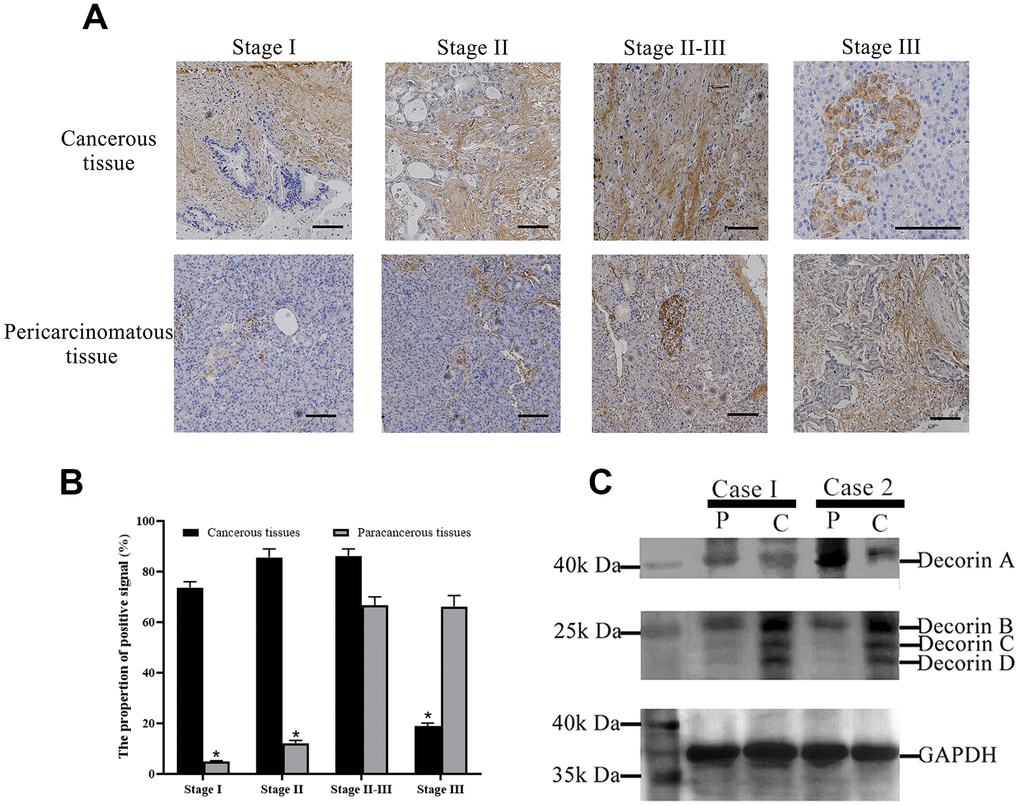
Figure 2.Decorin expression profile in PC patients. (A) Immunohistochemical analysis of decorin during the pathological stages of PC, bar indicates 100 μm; (B) The quantification of decorin during the pathological stages of PC based on the results of immunohistochemical analysis. (C) Western blot of decorin in cancerous and para-cancerous tissue of PC patients, C: cancerous tissues, P: paracancerous tissues.