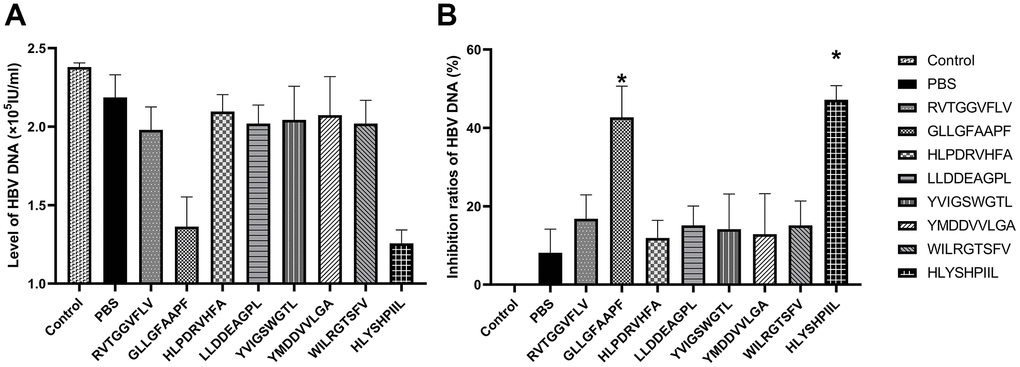
Figure 6.HBV gene expression assay. HepG2.2.15 cells were co-cultured with epitope-specific T cells. The HBV-DNA level of each group was shown in (A), and the inhibition ratio of HBV-DNA was shown in (B). The control group was HepG2.2.15 cells cultured without T cells, and the PBS group was HepG2.2.15 cells co-cultured with T cells stimulated by PBS. The mean ± SD from 3 independent experiments is shown. *Statistically significant compared to the PBS group.