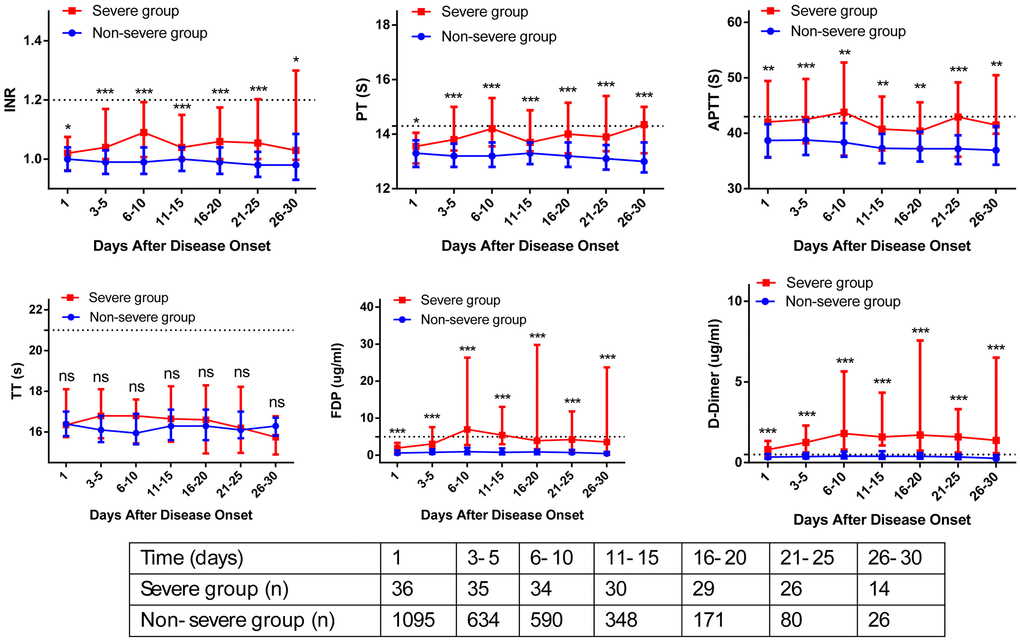
Figure 2.Dynamic profile of coagulation parameters in patients by severity of COVID-19. The coagulation parameters in the non-severe group (blue line) and severe group (red line) were analyzed at different time points after hospital admission. The coagulation parameters are shown using median and IQR.