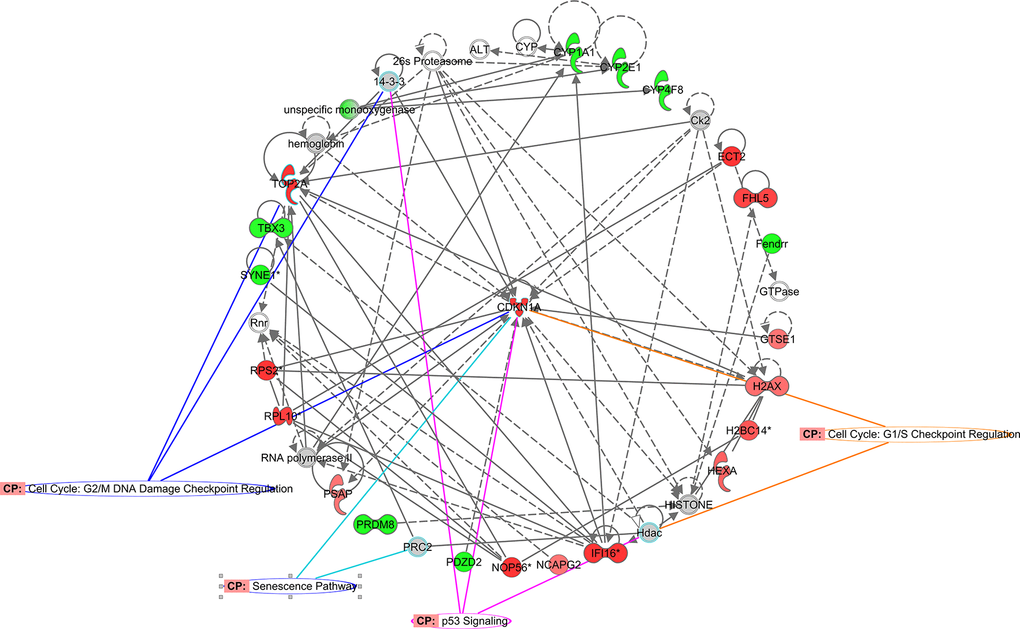
Figure 4.CDKN1a functional network identified using Ingenuity Pathway Analysis™. CDKN1a interaction network overlapping senescence associated pathways. Colored nodes refer to genes found in our dataset (green downregulated; red upregulated). Uncolored nodes were not identified as differentially expressed in our experiment and were integrated into the computationally generated IPA networks.