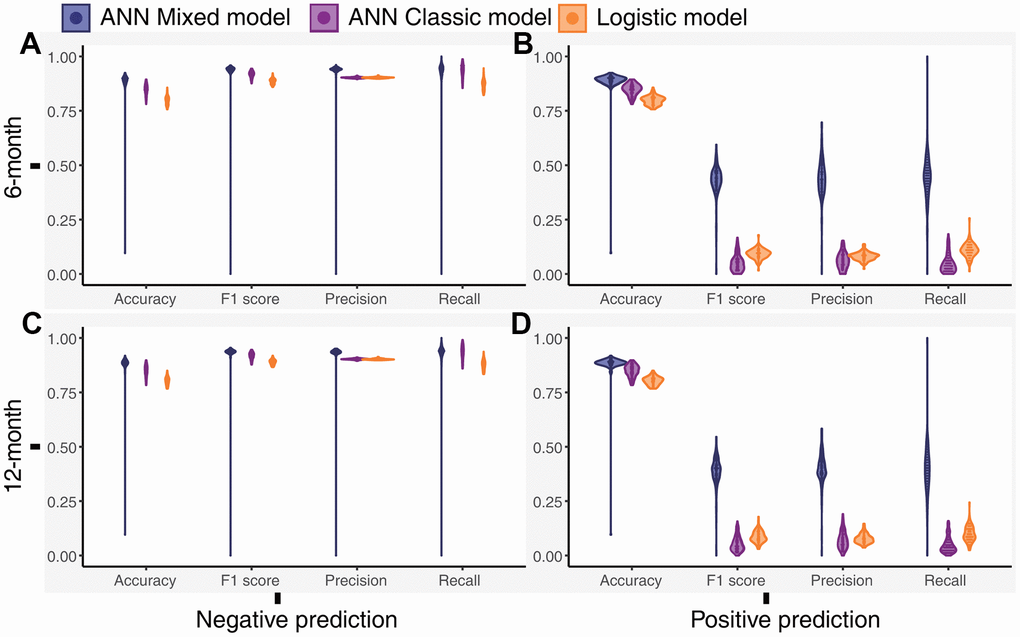
Figure 3.Distribution of the performance outcomes of the models for the 6-month and 12-month datasets. (A) Performance of the models for the negative prediction in the 6-month dataset, (B) Performance of the models for the positive prediction in the 6-month dataset, (C) Performance of the models for the negative prediction in the 12-month dataset, (D) Performance of the models for the positive prediction in the 12-month dataset.