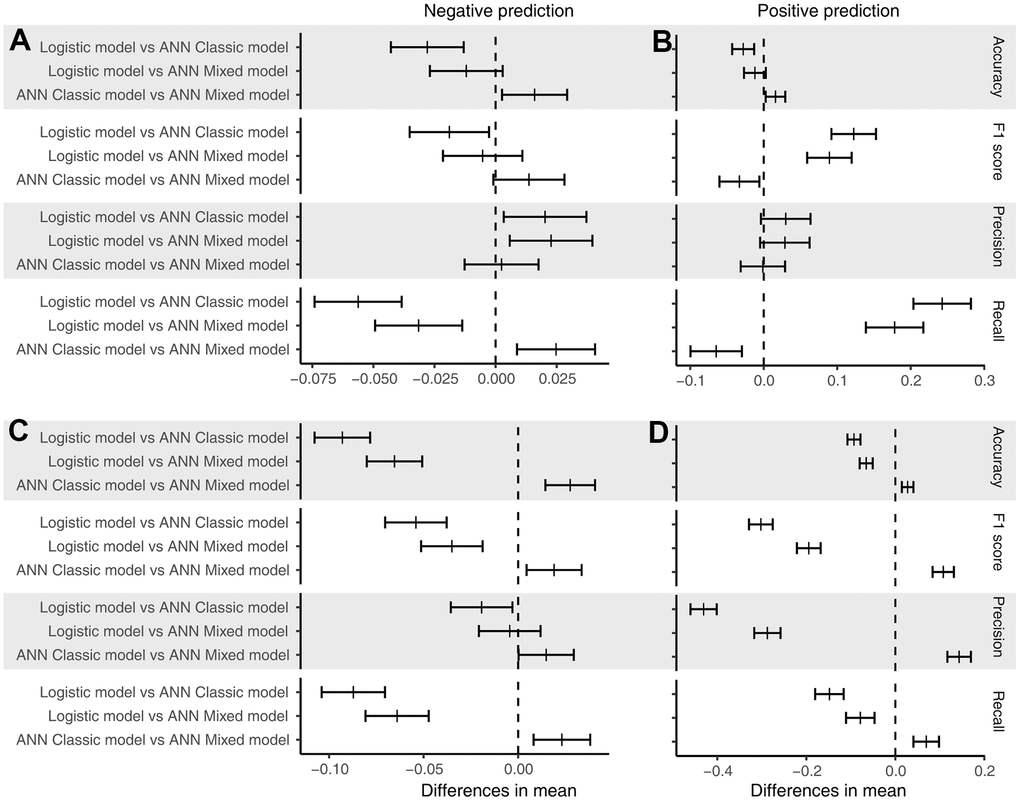
Figure 2.Post hoc test of performance. (A) Performance of the models for the negative prediction in the test dataset; (B) performance of the models for the positive prediction in the test dataset; (C) performance of the models for the negative prediction in the total dataset; and (D) performance of the models for the positive prediction in the total dataset. The short bar indicates the difference in the mean value with a 95% confidence interval.