Submit an Article
Navigate
Home
Editorial Board
Editorial Policies
Current Volume
Archive
Scientific Integrity
Publication Ethics Statements
Interviews with Outstanding Authors
Newsroom
Sponsored Conferences
Podcast
Contact
Special Collections
Submit an Article
Online ISSN: 1945-4589
Research Paper
|
Volume 13, Issue 10
|
pp. 14039–14052
Combined healthy lifestyle score and risk of epigenetic aging: a discordant monozygotic twin study
Back to article
Figure 1
(1 of 2)
−
100%
+
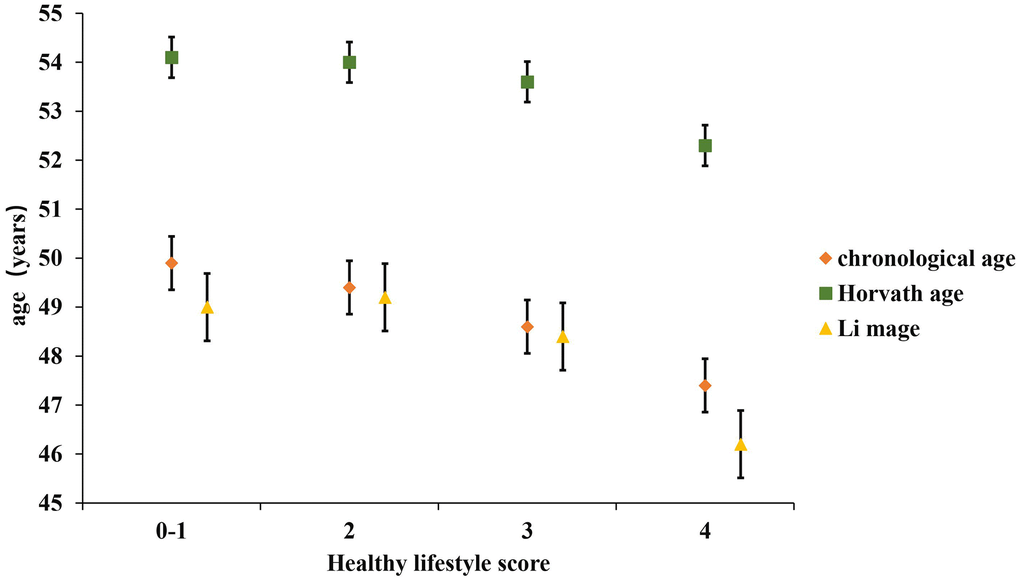
Figure 1.
Distribution of two kinds of predicted DNAm age and chronological age by healthy lifestyle score.
Data were shown as mean±standard error.