Submit an Article
Navigate
Home
Editorial Board
Editorial Policies
Current Volume
Archive
Scientific Integrity
Publication Ethics Statements
Interviews with Outstanding Authors
Newsroom
Sponsored Conferences
Podcast
Contact
Special Collections
Submit an Article
Online ISSN: 1945-4589
Research Paper
|
Volume 13, Issue 9
|
pp. 13318–13332
Development of a prognostic model for hepatocellular carcinoma using genes involved in aerobic respiration
Back to article
Figure 2
(2 of 13)
−
100%
+
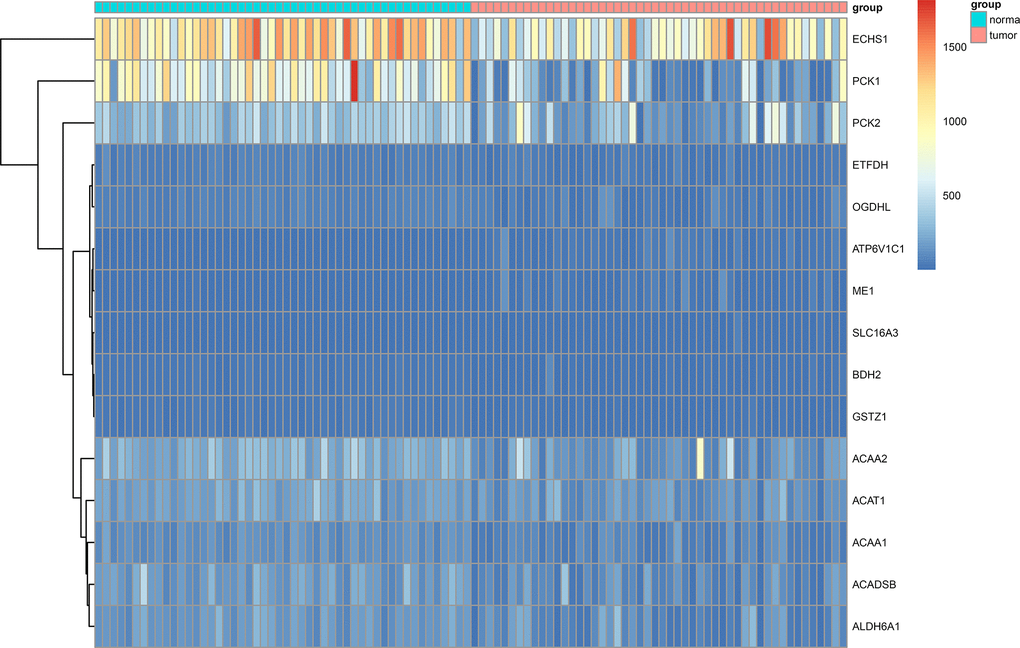
Figure 2.
Heat map showing differentially expressed genes in aerobic respiration between 50 matched hepatocellular carcinoma and normal tissue pairs in the TCGA cohort.