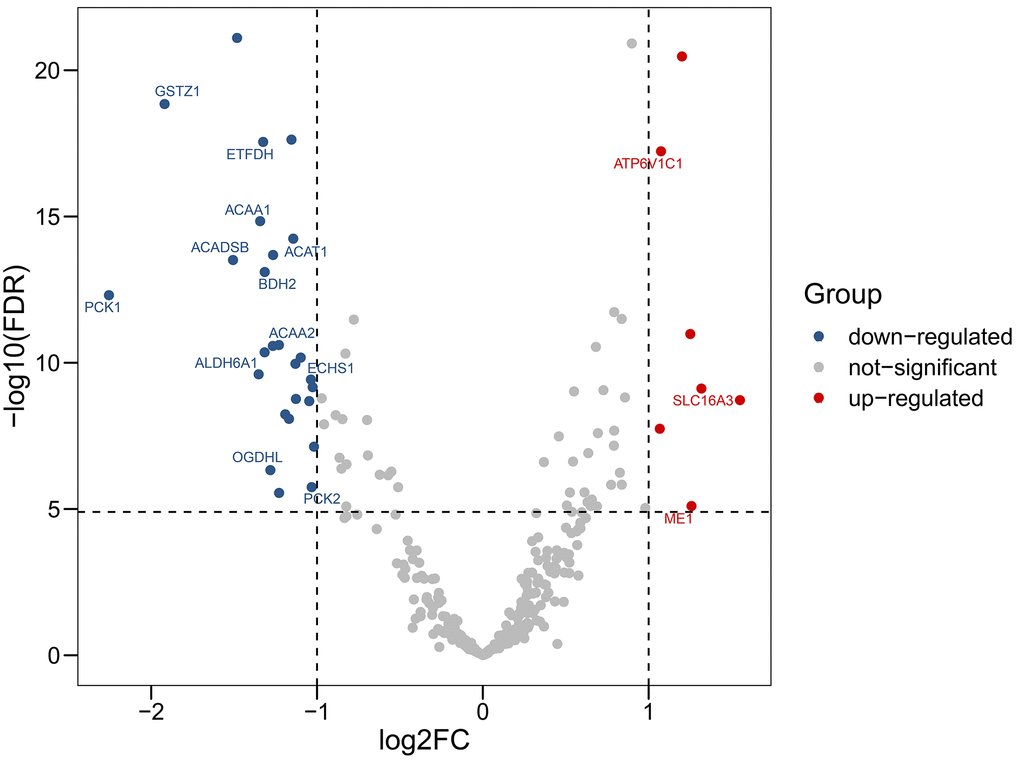
Figure 1.Volcano plot showing differentially expressed genes in aerobic respiration between hepatocellular carcinoma and normal tissues. Red dots represent significantly up-regulated genes, blue dots represent significantly down-regulated genes, and gray dots represent no differences between genes.