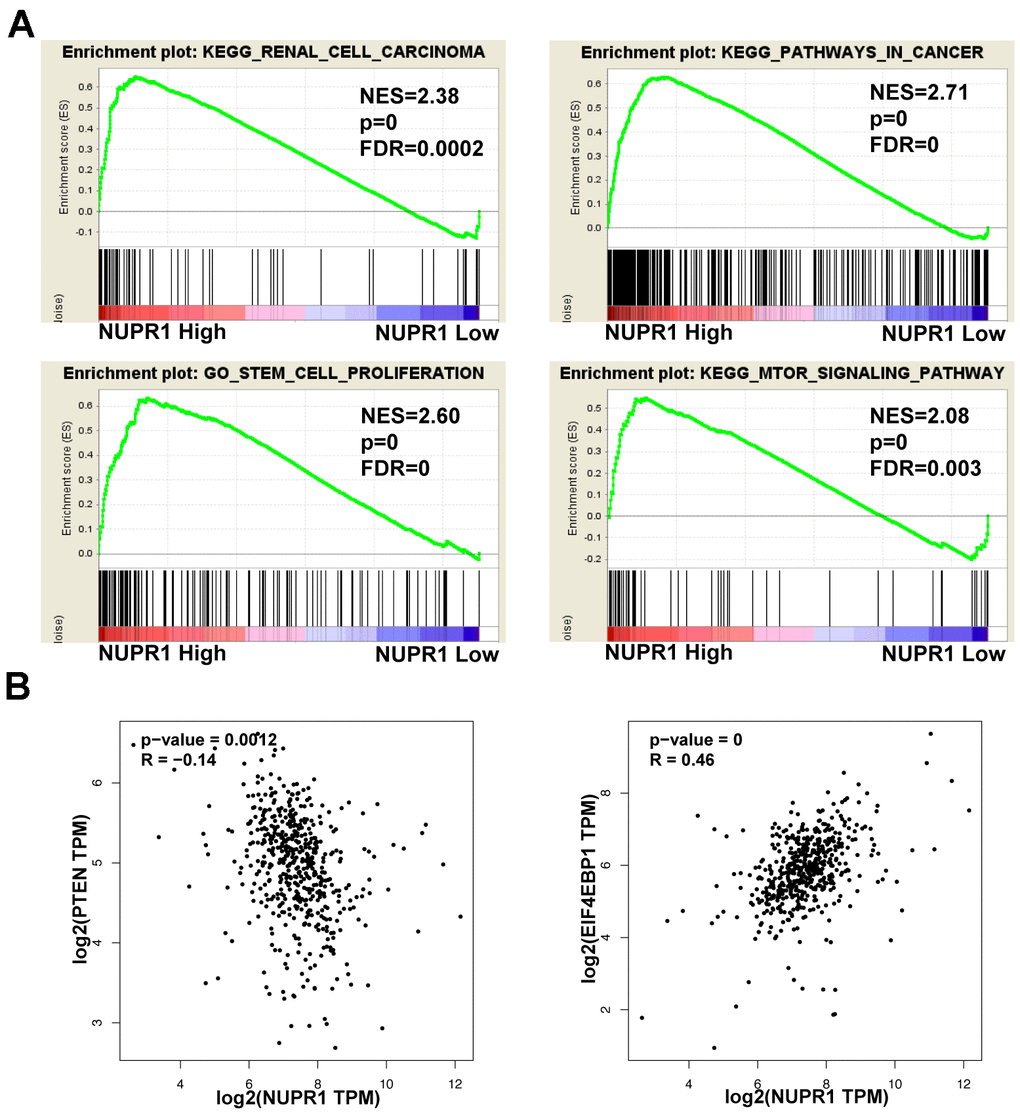
Figure 5.Pathways involved in the pathogenesis of NUPR1 with GSEA and correlation analysis between NUPR1 and PTEN, 4EBP1 in TCGA-KIRC cohort. (A) Enrichment curves for activated gene sets using GSEA pathway analysis. (B) Correlation between NUPR1 and 4EBP1 in TCGA-KIRC dataset. (*p < 0.05, **p < 0.01, ***p < 0.001). GSEA: gene set enrichment analysis; KIRC: Kidney renal clear cell carcinoma; TCGA: The Cancer Genome Atlas database.