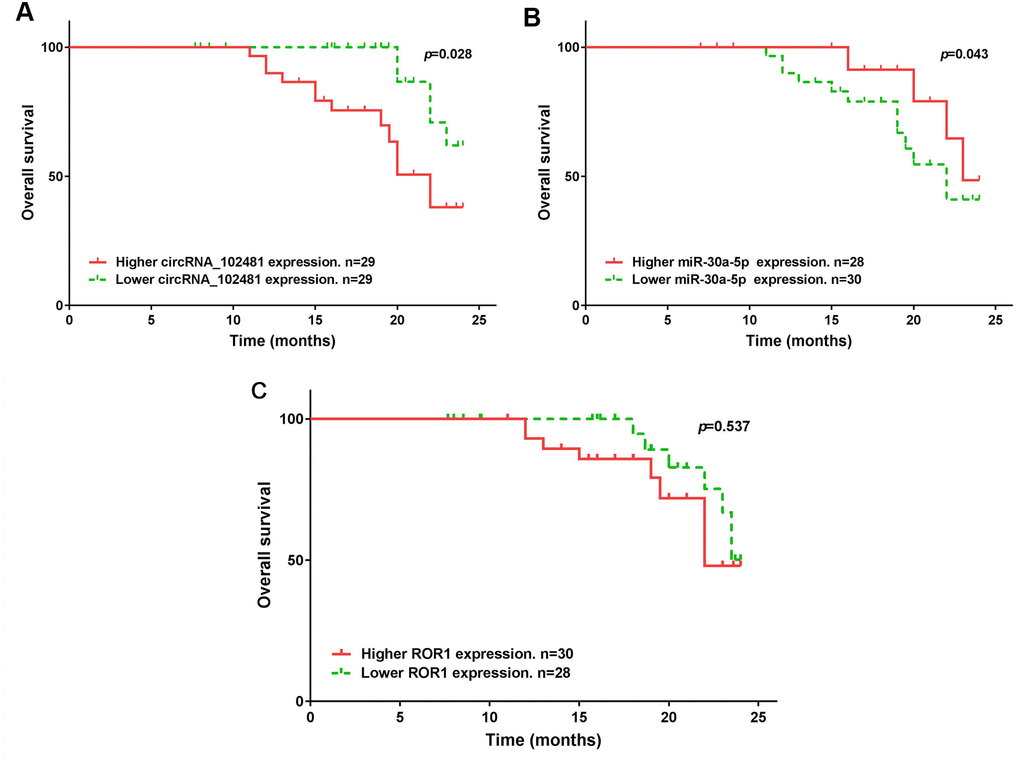
Figure 15.Kaplan-Meier OS curve stratified by exosomes circRNA_102481- miR-30a-5p-ROR1 axis expression. OS duration between higher and lower (A) exosomes circRNA_102481, (B) exosomes miR-30a-5p, (C) exosomes ROR1 mRNA.
Figure 15 — Tumor-derived exosomal circRNA_102481 contributes to EGFR-TKIs resistance via the miR-30a-5p/ROR1 axis in non-small cell lung cancer | Aging