Submit an Article
Navigate
Home
Editorial Board
Editorial Policies
Current Volume
Archive
Scientific Integrity
Publication Ethics Statements
Interviews with Outstanding Authors
Newsroom
Sponsored Conferences
Podcast
Contact
Special Collections
Submit an Article
Online ISSN: 1945-4589
Research Paper
|
Volume 13, Issue 9
|
pp. 13264–13286
Tumor-derived exosomal circRNA_102481 contributes to EGFR-TKIs resistance via the miR-30a-5p/ROR1 axis in non-small cell lung cancer
Back to article
Figure 14
(14 of 15)
−
100%
+
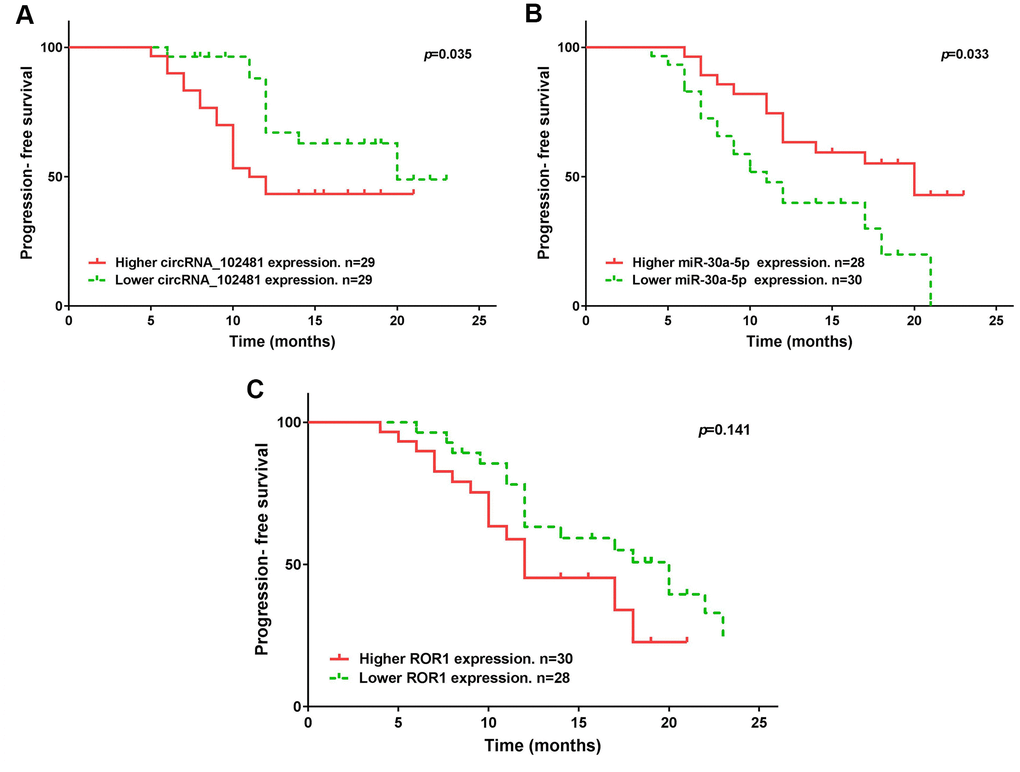
Figure 14.
Kaplan-Meier PFS curve stratified by exosomes circRNA_102481- miR-30a-5p-ROR1 axis expression.
PFS duration between higher and lower (
A
) exosomes circRNA_102481, (
B
) exosomes miR-30a-5p, (
C
) exosomes ROR1 mRNA.