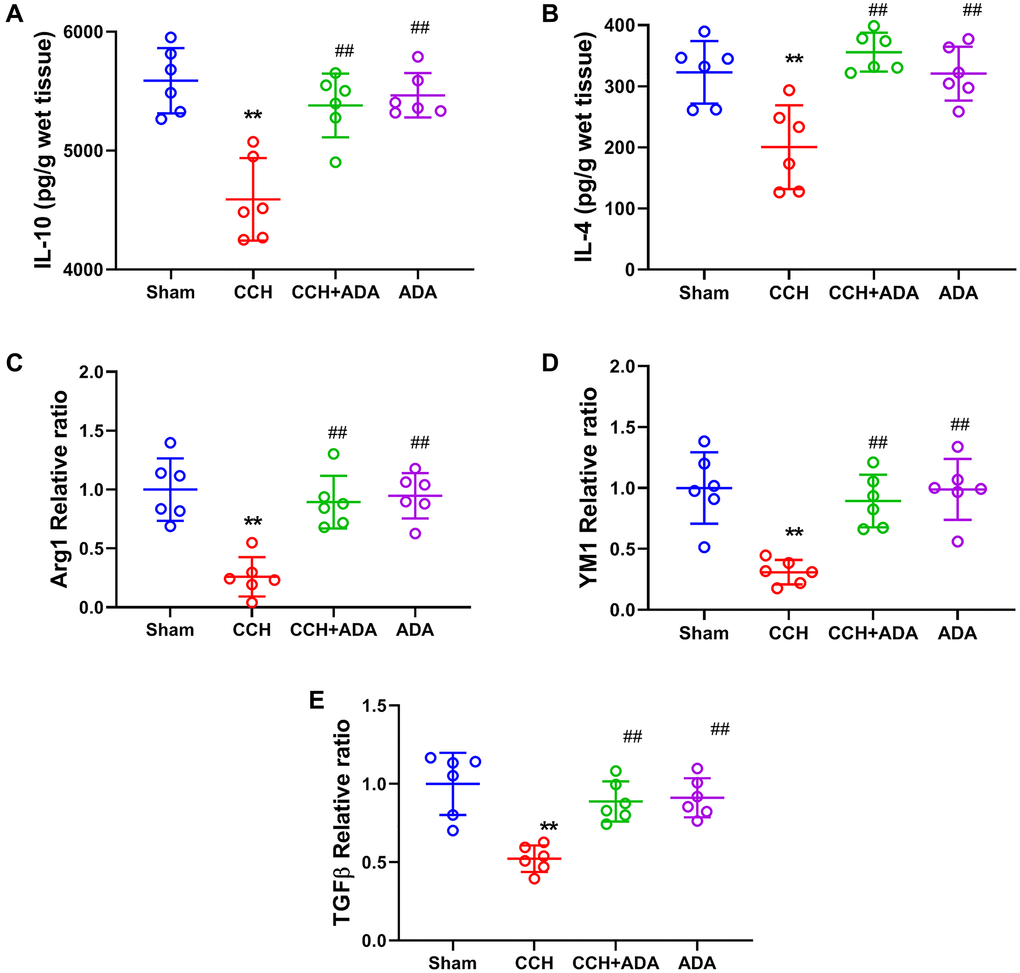
Figure 6.ADA elevated the expression of M2 markers. (A–B) The expression of the M2 markers IL-10 (A) and IL-4 (B) was evaluated by ELISA kits. (C–E) The mRNA levels of Arg1 (C), YM1 (D) and TGF-β (E) were evaluated by Q-PCR. All values are expressed as the mean ± SEM (n = 6). **p < 0.01 vs. the sham group; ##p < 0.01 vs. the CCH group.