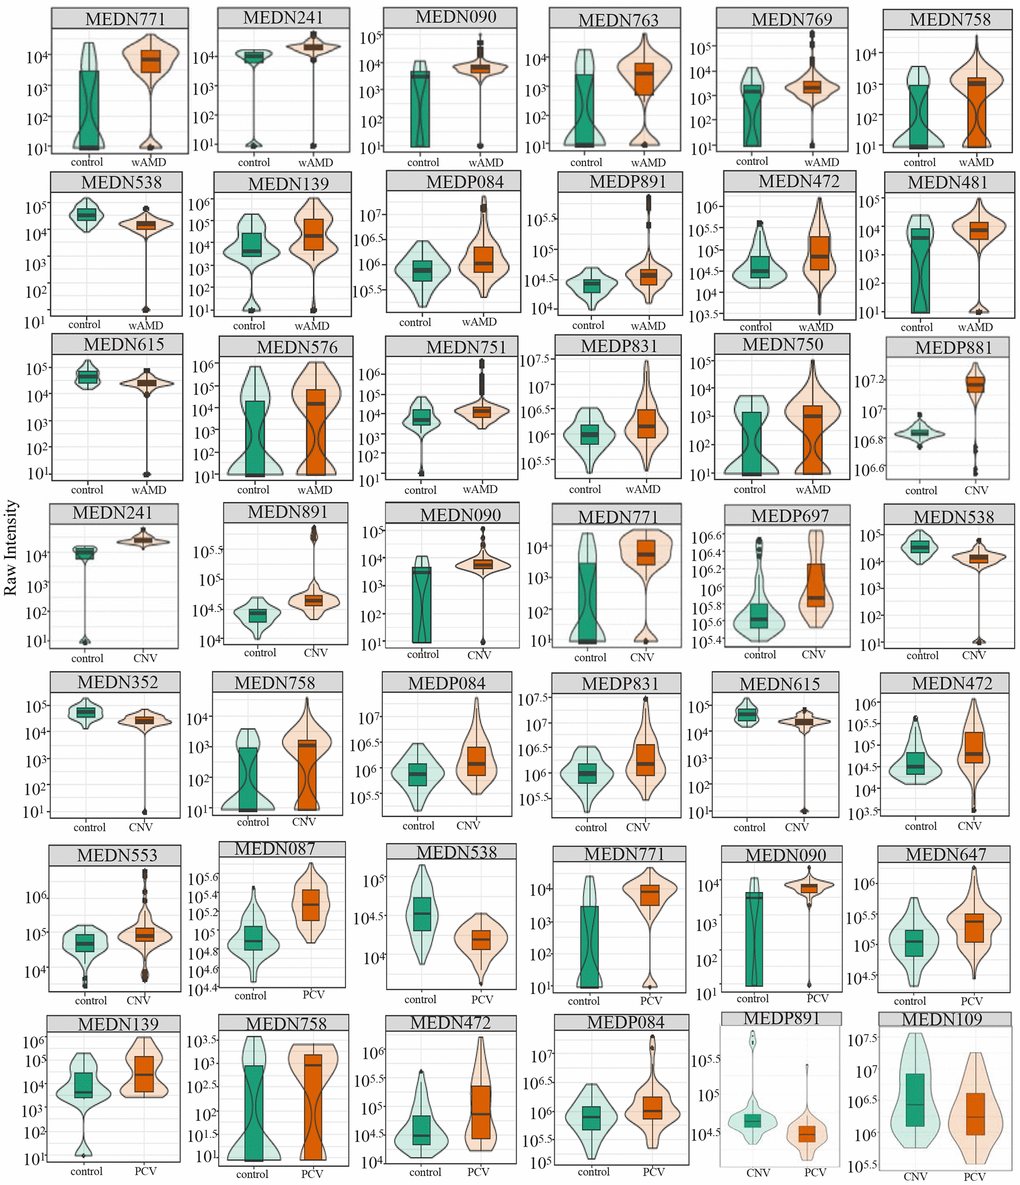
Figure 3.Relative contents of differential metabolites among wAMD group, CNV group, and PCV group. The box in the middle represents the quartile range, the thin black line extending from it represents the 95% confidence interval, the black horizontal line in the middle is the median, and the external shape represents the distribution density of the data. wAMD: Wet AMD group (CNV and PCV together).